Beam Data Conversion Utilities
Windows
Mouse in Command Prompt Windows
Linux
Mouse in X terminal Command Prompt
Windows
Converting
percent depth dose files
Converting
in water diagonal scan data
Converting
In Air Diagonal Scans
Specific
Beam Data Acquisition Utilities
Introduction
The utilities below are useful for converting beam data to the format required by DosimetryCheck and RtDosePlan. They are all ASCII programs that are run in a command prompt window, and generally take one or two arguments: the file to read in, and in some cases, the file to write out. Running the programs without any arguments will list the arguments required. Note also the directions for enabling the use of the mouse in a command prompt window to copy and deposit text, and the use of the up arrow key to retrieve a prior typed command. There is very little reason to have to do much typing. WordPad can be used for editing files, or vi downloaded from cygwin in a cygwin bash shell window.
For example, from c:\mathresolutions type:
tools.dir\ReadTextColumns bd.d\machine\data.d\in_file bd.machine\data.d\outfile
If another window is open in the directory where the data is, one can copy the path with the mouse and not have to type in a path. Raw data should go into a subfolder with X06, X15, etc., restricted to the actual input and output files DosimetryCheck, GenerateBeamParamenters, ComputePolyCAFiles, and RtDosePlan will read.
The beam data is in the directory bd.d, which is named by the location file BeamData.loc in the program resources directory, which is in turn named by the file rlresources.dir.loc in the home directory.
See also Beam Data in the user’s manual for a description of the files.
Windows Mouse in Command Prompt Windows
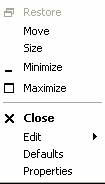
In Windows you can avoid typing by right clicking on the title bar of the command prompt window and select Properties:
Then on the Properties popup select Quick Edit Mode
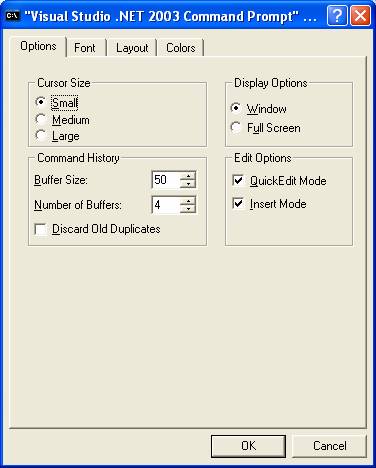
This will allow you to high light text with the left mouse. Clicking with the right mouse once will copy it, and clicking with the right mouse afterwards will deposit this text in any command prompt window. Some versions of cygwin might use the middle mouse. Control V will deposit in a Windows window, such as Word or Excel. Also don’t forget the up arrow key will retrieve prior commands you have typed in.
Linux Mouse in X terminal Command Prompt Windows
In linux and unix, you only need to high light text with the left mouse. Middle mouse will then deposit the text elsewhere. Also don’t forget the up arrow key will retrieve prior commands you have typed in.
Beam Data in Table Format
Preferred method is to get data in a table format. The programs: ConvertMSExcelPDD, ConvertMSExcelDiag, and ConvertInAir will be describe below.
From Microsoft Excel, write the files out in text format. Do any necessary editing in Excel or in the text format, which ever is more convenient. Excel has a lot of capabilities for managing data, such as copying columns or rows of data, copying to a new worksheet, and equations for performing operations on the data. Excel can write out a work sheet in a text format to be further edited and read by a conversion utility.
Conversion Utilities
Programs have been written to convert data written by beam data acquisition systems to the format needed by Dosimetry Check (and RtDosePlan for the same files involved), and are documented below. However, it seems that the format often changes with the version of the software of the particular system and there is not a common standard. However, recently those systems are able to write to Microsoft Excel, and this will provide us a common format for input. We will describe three programs that can be used to read data into our beam data format from a more common text format:
ConvertMSExcelPDD: for reading in in water percent depth dose data.
ConvertMSExcelDiag: for reading in in water diagonal scan data.
ConvertInAir: for reading in in air diagonal scan data. Note that a scan taken at dmax in water can serve as an in air scan, as the two will be very close together.
However, none of these program directly reads a Microsoft Excel file. Rather you have to save a sheet in text format and read the text file. All three programs are ASCII programs that must be run in a command prompt window. Run the programs from the main directory where DosimetryCheck is installed, typically in Windows this is c:\mathresolutions. C:\mathresolutions contains dll files needed by Microsoft programs. An alternative is to add the path c:\mathresolutions to the system paths so that c:\mathresolutions will be searched for dll files during run time. On linux, this is not an issue. The program are stored in the directory tools.dir. To invoke the programs type:
tools.dir\ ConvertMSExcelPDD.exe path_to_file_to_read
where the second argument is the path to the input file to be read. If you do not enter a second argument, then the program will prompt you to enter a path to a file later on in the program. In linux, it is tools.dir/ConvertMSExcelPDD, etc..
Upon running the programs, the programs will prompt you to choose the accelerator from the list in the beam data directory, and the list of energies. Therefore you must have first created a directory entry and in that directory and then created a Geometry file and a Photons file. For each energy listed in Photons you must create a directory: X06 for 6x, X18 for 18x, for example.
Converting percent depth dose files
You will be prompted to enter the SSD and a dmax depth. The dmax depth is only use for normalization in the output tables and will not affect the pencil beam dose kernel that is produced.
The file must be edited to have the below format. Either do this in Excel and the save as a text file or edit the text file. The first line read is as below with the word “Depth” in it:
Depth (cm) 2 X 2 cm
3 x 3 cm 4 X 4 cm 5 X 5 cm
6 X 6 cm 7 X 7 cm
There may not be lines of data above the line with the word “Depth”. The program reads lines until it finds a line with the word “Depth” and assumes that line is the beginning of the percent depth dose table. After the word “Depth” may be cm or mm which will designate whether the column under depth is the depth in cm or mm.
The field sizes are listed in the rest of the line. There must be a ‘x’ or ‘X’ between each dimension of the field size. The field size must be in centimeters. All other text in the line is ignored, so the following cm in the above example is ignored. The program looks for numbers only and is expecting two numbers for each column of data. This line can wrap on your text editor but is assumed to end with a new line. The entire table can be in one unit, with lines too long for your text editor too show as one line as long as the lines are wrapping around and there is not a new line within a line of data.
The percent depth dose data follows on the next line (no blank lines in between). The data does not have to be arranged in neat columns. All that matters is that each line of data contain the depth in the first field, and a percent depth dose for each field size in the above line. It does not matter how the data is normalized as it will be renormalized to 100 at dmax when printed out. In the below we see depths of 0.0 cm, 0.1 cm, and 0.2 cm. Since there are six field sizes above, there must be data for six field sizes.
0.0
47.87 50.98 49.71
52.58 54.41 55.71
0.1 53.77
56.99 55.78 59.25
61.28 61.97
0.2 60.53
63.6 64.21 67.75
69.65 70.08
The last depth should either be followed by the end of the file or a blank line.
After the blank line you can continue the table with more field sizes if the data is not in a single table unit, for example:
8x8 10x10 15x15 20 x 20
30X30 40x40
The data must follow as above, starting with the depth value. The list of depths must agree with the depths in the first part of the table.
The program will prompt you to enter the nominal dmax value in cm.
The program will write out a CA file for each field size, then the file list CAFileListw00_06 file, which list the CA files to be used, and the Dmax06 file (here names shown for 6x).
Converting in water diagonal scan data
Program ConvertMSExcelDiag will convert in water diagonal scan data to our format. The program is again run in a command prompt window and the first argument is the path to the text file to be read. The data may be organized into a single block of data or organized in separate scan columns, one for each depth. The data can be from the central axis out to a corner or a complete scan from one corner to another. There may be a scan for each diagonal. It is assumed that the scans were done at 100 cm SSD and are for the diagonal of the largest field size. This program will write out the file DiagFanLine40.0_w00_06 (assuming 40 is the maximum field size in this example). The maximum field size is specified in the Geometry file.
After prompting you to select the machine directory and energy, the program will prompt you to enter the organization of the data:
Enter:
1 if file format is one scan at a time
OR
2 if in a table in columns:
Then the program will prompt for how the distance from the central axis is specified:
Enter:
1 if offset data is in terms of the
tangent
2 if data is distance in cm from the
c.a. (at 100 cm)
3 if data is distance in mm from the
c.a. (at 100 cm)
One scan at a time
In this organization the data is in columns, one column per depth. An example is:
Depth =
1.5cm
0.255 31.45
0.250 54.67
0.245 96.50
0.240 101.21
0.235 102.60
0.230 103.85
0.225 104.30
...
0.015 100.90
0.010 100.50
0.005 100.20
0.000 100
Depth =
5cm
0.255 32.39
0.250 55.5905
0.245 89.05797
Each scan must start with the line “Depth = “ followed by the depth in cm or mm, with the cm and mm present.
Next follows the offset, either the tangent value, or the offset in mm or cm. Then the value for that offext. A blank line will separate scans.
Table in columns
In this organization the data may be in a table of scans. An example of the data:
Depth mm
6
15
50 100 200
250 300
-188 1.63
2.07 3.54 6.83
8.75 11.6
-187 1.62
2.28 3.54 7.24
9.27 11.53
-186 1.63
2.28 3.68 7.24
9.28 11.89
-185 1.72
2.28 3.68 7.46
9.56 12.24
-184 1.72
2.39 3.81
7.69 9.85 12.6
-183 1.82
2.39 3.81 7.68
10.12 12.96
-182 1.82
2.5 3.94 7.9
10.13 13.33
...
187 1.64
2.19 3.42 6.63
8.78 10.88
188 1.64
2.19 3.44 6.66
8.24 10.19
99999
15
50 100 200
250 300
-200 1.14
1.19 1.75 4.16
5.61 6.85
-199 1.14
1.19 2.02 4.16
5.61 6.85
-198 1.14
1.29 2.02 4.16
5.61 6.85
...
198 1.64
2.29 3.68 7.31
9.35 11.66
199 1.64
2.29 3.68 7.3
9.35 11.66
200 1.64
2.07 3.4 6.86
9.35 10.91
There must be a line with Depth with mm or cm. The next line will be the number of scans that will be in the table. The next line will be the list of depths in mm or cm as designated in the prior line.
Then the data is to follow. In the above example the offset is in mm, followed by a value for each scan. The list ends with a blank line. The number 99999 may then be present to signal that the other diagonal is to follow, or otherwise the file simply ends.
Converting In Air Diagonal Scans
Run program ConvertInAir to read in the diagonal in air scan. This scan may be measured at any distance. After selecting the machine and energy that the data is for, you will be prompted for the off set denominator that will convert the data to the tangent:
Enter
value to divide first column by to get tangent.
(distance of
measurement, typically 100 cm. If in mm then 1000):
This is the number than when divided into the first number of each data pair, will give the tangent. For example, if the data was scanned at 100 cm and is in cm, you would enter 100. If in mm you would enter 1000. If in mm but measured at 90cm, you wound enter 900.
You can use an in water at dmax scan for an in air scan as the two will be very close. In that case, if the dmax depth is 1.5 cm and the SSD is 100 cm, the distance would be 101.5 if in cm or 1015 if in mm.
Input data example follows. The data can be any order, and a second scan can follow after a blank line. There must be a 0.0 point (on the central axis) for each scan however.
-15.00 0.009
-14.00 0.014
-13.75 0.016
-13.50 0.050
-13.25 0.021
...
-2.00 0.464
-1.00 0.462
0.00 0.462
1.00 0.463
2.00 0.466
...
13.75 0.014
14.00 0.012
15.00 0.009
-15.00 0.009
-14.00 0.014
-13.75 0.016
-13.50 0.050
-13.25 0.021
...
14.00 0.012
15.00 0.009
This program will write out the file InAirOCR06 (for 6x).
Other Files
The other files you will have to write are the calibration file Calibration06, the output factors file OutPut_w00_06 (names shown here for 6x), and possibly the dmax file. You can copy from another machine and edit the files accordingly.
The output file (OutPut_w00_06) will have to be updated for the user’s measured output factors. Note the values are in cGy/mu. The output values must be consistent with the calibration file above.
The dmax file, Dmax06, states the nominal dmax depth. The percent depth dose files do not have to be normalized to dmax or any depth. The value is only used here to determine the depth at which to compute Sc and Sp factors.
The below files are supplied by other programs and are used for the conversion of exit images to in air fluence images for DosimetryCheck:
AirGapCorrectionFile06 produced by program FitAirGapCorrection.
InWaterTransmissionFit06 produced by program FitTransData.
The file InWaterTransmission06 is an input file to produce the above fit file by program FitTransData and does not need to remain in the energy directory.
In the machine directory, the text file Photons list the energies for the machine.
The file Geometry is to describe the coordinate system of the machine and should be reviewed for correctness. For DosimetryCheck, limits of movements of the field jaws are irrevelant.
When Done
GenerateBeamParameters must be run to generate the polyenergic pencil kernel and other files. Run program tools.dir\GenerateBeamParameters
Generate Beam Parameters
The program is run from a command prompt window:
tools.dir\ GenerateBeamParameters.exe
You will be prompted to select the machine and energy.
The input files are:
CA01.0x01.0_w00_06
CA02.0x02.0_w00_06
CA03.0x03.0_w00_06
CA04.0x04.0_w00_06
CA06.0x06.0_w00_06
CA08.0x08.0_w00_06
CA10.0x10.0_w00_06
CA12.0x12.0_w00_06
CA15.0x15.0_w00_06
CA20.0x20.0_w00_06
CA30.0x30.0_w00_06
CA40.0x40.0_w00_06
CAFileListw00_06
DiagFanLine40.0_w00_06
OutPut_w00_06
InAirOCR06
Dmax06
Calibration06
Note that file CAFileListw00_06 contains the list of the CA files and only files in the list are used.
The output files are:
PencilSpectrumList
PencilSpectrum40_06
PolyPencilKernel06
OffAxisDepthCorrect06
DoseConvertConstant06
FieldSizeFactors_06
CollimatorScatter06
Central Axis
Report File
This file is written by program ComputePolyCAFiles and contains the report of comparing the same central axis points calculated with the pencil dose kernel to the data used to generate the pencil kernel, namely the central axis data files and the machine output file. This file is an ASCII file which may be printed. Both the percent depth dose is compared and the dose rate in cG/mu (but only if an output value exist for the percent depth dose scan at the same SSD). A standard deviation is computed at the end of the printout. The standard deviation is only computed for points dmax or deeper.
Example file name: Careport06.txt
Example from one field size comparison:
Comparison to measured data for field size 15.00 by 15.00 cm
% depth dose dose
rate
Depth
Measured Calculated Difference Measured Calculated Diff
0.00 49.55
49.66 0.11 0.4945
0.4956 0.0011
0.50 70.33
71.64 1.31 0.7019
0.7149 0.0130
1.00 96.18
96.23 0.05 0.9599
0.9604 0.0005
1.50 100.18
100.11 -0.07 0.9998
0.9991 -0.0007
1.60 100.00
100.00
0.00 0.9980 0.9980 0.0000
2.00 99.30
99.25 -0.05 0.9910
0.9905 -0.0005
3.00 95.29
95.46 0.17 0.9510
0.9527 0.0017
4.00 91.77
91.94 0.17 0.9159
0.9175 0.0017
5.00 88.17
88.04 -0.13 0.8799
0.8786 -0.0013
Example summary at the end of the file:
SL20 6 MeV
Standard
Deviation Summary (beyond depth of 1.60 cm):
field size %
depth dose dose
rate
3.00
by 3.00 0.140 0.00125
4.00
by 4.00 0.081 0.00074
5.00
by 5.00 0.217 0.00200
6.00
by 6.00 0.161 0.00150
8.00
by 8.00 0.163 0.00155
10.00 by 10.00 0.140 0.00136
12.00 by 12.00 0.103 0.00101
15.00 by 15.00 0.074 0.00074
20.00 by 20.00 0.088 0.00090
25.00 by 25.00 0.066 0.00069
30.00 by 30.00 0.086 0.00090
35.00 by 35.00 0.137 0.00144
40.00 by 40.00
Text Editing Utilities
These utilities will perform specific functions, reading in a text file and writing one out.
ReadTableDiagonal.exe
Pogram to read the diagonal of a text table of numbers and print as two columns.
Format of input file:
1
2 3 4
5
1 43
89 89 67
56
2 46
65 89 89 56
3 34
687 7 87
8
4 7
5 0 78
8
5 7
8 89 57
67
output will be:
1 43
2 65
3 7
4 78
5 67
ReadTableOfOutputs.exe
Pogram to read the diagonal of a text table of numbers and print as three columns, where the numbers are output factors. User will be prompted to enter a SSD and a depth in cm.
Format of input file:
3
4 5 7
10 15 20
30 40
3 0.829
0.8409 0.8481 0.858
0.8647 0.8701 0.8727
0.8761 0.8775
4 0.8412 0.8555
0.8653 0.8773 0.8859
0.8938 0.8967 0.9005
0.9021
5 0.8505 0.8669
0.8781 0.8923 0.9031
0.9121 0.9153 0.9204
0.9223
7 0.8623 0.8819
0.8955 0.9138 0.9271
0.9393 0.944 0.9509
0.9532
10 0.8734 0.8951
0.9107 0.9324 0.9508
0.966 0.9725 0.9813
0.9853
15 0.8827 0.907
0.9253 0.9502 0.9713
0.9907 1.0007 1.0124
1.0178
20 0.8879 0.9136
0.9325 0.9593 0.9837
1.0052 1.0169 1.0317
1.0391
30 0.8947 0.9212
0.9409 0.9696 0.9961
1.0212 1.0367 1.055
1.0635
40 0.8997 0.9265
0.9484 0.9772 1.0059
1.0326 1.0499 1.0701
1.0814
output will be (SSD and depth the numbers you entered) in the format of the data portion of an output factors file:
3.0
3.0 95.00
5.00 0.8290
4.0 4.0 95.00
5.00 0.8555
5.0 5.0 95.00
5.00 0.8781
7.0 7.0 95.00
5.00 0.9138
10.0 10.0 95.00
5.00 0.9508
15.0 15.0 95.00
5.00 0.9907
20.0 20.0 95.00
5.00 1.0169
30.0 30.0 95.00
5.00 1.0550
40.0 40.0 95.00
5.00 1.0814
ReadTextColumns.exe
Program to read two selected columns of data from a file with multiple columns, normalize, and write out just the two columns of data. User will be prompted to enter a normalization factor for each column. The input file must consist of data separated by white space, with each row ended by a line feed or carriage return. There must be the same number of columns in each row. The data must all be numeric data.
TakeTranspose.exe
Program to read a text file and write out the transpose of a matrix. The file must be text (any text) arranged in columns. Space separates items. Microsoft Excel can also take a transpose.
ReadOCRText
Program to read tabulated text data, radius versus signal, for the X coordinate and signal value in two input files, and produce an OCR table that can be copied into an in air OCR file.
ReadOcrData
Program to read in two column of numbers, average duplicate results, right back out as tangent value. Program assumes this was from a scan symmetric about the central axis at zero.
ReplaceText
This program will search all files in a directory for a specific text stream and replace the text with another stream. Example use would be:
$ tools.dir/ReplaceText.exe "*" "String to replace" "New string to put in"
Search files * for the string "String to replace" and replace with "New string to put in"
Is this right? (y or n)
Specific Beam Data Acquisition Utilities
Utilities have been written to read specific beam data acquisition system formats and are listed below. However, many of these systems now have the capability of writing data to a Microsoft Exel spreadsheet, and one can then use the table formatted programs written for that purpose describe above.
ConvertEcWpPdd
Program to read WP600 format PDD file and write data files out for the beam directory, converting the format. Example file:
machine: 21exs, 6X
algorithm: Photon_PBC7234
beam data: 06 MV GBD 21EX 01/01
add on: Open Field - 00
data: Measured Depth Dose Data
beam: high energy photons
energy [MV]: 6
SSD [mm]: 984
exporting date: April 29, 2005
column legend: Field Size [mm]
row legend: Depth [mm]
data legend: Dose [%]
, 30, 40, 60, 80, 100, 120, 150,
200, 250, 300, 350, 400
0.0, 41.60, 42.40, 43.90, 45.70, 47.30, 49.20, 51.40,
55.50, 59.00, 62.10, 64.30, 66.20
5.0, 70.00, 70.60, 71.40, 72.60, 73.70, 75.20, 76.30,
79.20, 81.70, 83.50, 84.70, 85.90
ConvertEcWpDiag
Program to read WP600 format extended diagonal files and write data file out for the beam directory, converting the format. Example file:
$NUMS 1
$STOD
%title: Extended Profiles
%beam: high energy photons
%SSD: 1000
%field size: Diagonal
%curve: profile
%depth: 0.0 0.0 200.0
%direction: 1 1 0
%number of points: 199
%axis legend: Transversal
%data legend: Dose
%measurement depth: 200
<0.000000 100.000000>
<2.500000 100.028527>
<5.000000 100.109768>
...
<480.000000 0.438013>
<482.500000 0.438013>
<485.000000 0.438013>
<487.500000 0.438013>
<490.000000 0.438013>
<492.500000 0.438013>
<495.000000 0.438013>
$ENOD
ConvertEcWpScan
Program to read WP600 format Scan file and write data files out for the beam directory, converting the format. Example file:
machine: 21exs, 6X
algorithm: Photon_PBC7234
beam data: 06 MV GBD 21EX 01/01
add on: Open Field - 00
data: Measured Profile Data
beam: high energy photons
energy [MV]: 6
SSD [mm]: 984
exporting date: April 29, 2005
column legend: Field Size [mm]
row legend: Off-axis Position [mm]
data legend: Dose [%]
Profiles at depth [mm]: 16.000
, 30, 40, 60, 80, 100, 120, 150,
200, 250, 300, 350, 400, 410
-497.5, 0.000, 0.000, 0.000, 0.000, 0.000, 0.000, 0.000,
0.000, 0.000, 0.000, 0.000, ,
ConvertOPDFile
Program to read PDD files, in W2CAD format, write data files out to the beam directory, converting the format. Example of format:
File name: 1800OPD.asc
$NUMS 012
$STOM
#
#2100 #1183 18 MV Photons
#FIELD SIZE 3x3 cm
#
%DATE 10-09-97
%DETY CHA
%BMTY PHO
%TYPE OPD
%AXIS Z
%PNTS 063
%STEP 050
%SSD 1000
%FLSZ 030*030
<+000.0 +000.0 +000.0 +018.0>
<+000.0 +000.0 +005.0 +038.1>
<+000.0 +000.0 +010.0 +067.0>
<+000.0 +000.0 +015.0 +083.2>
<+000.0 +000.0 +020.0 +092.2>
ConvertDPRFile.exe
Program to convert W2CAD format profile data. See above.
ConvertPTWexp
Program to read a text file from PTW exp format for percent depth dose data. Example data: for percent depth dose data.
BEGIN_EXPORT
PTW-Freiburg Mephysto Export V.6.0
20-JUN-2008 9:36
BEGIN_GROUP ANAC20807
STANDARD PHOTONS CAX 1 1000 0.0 0 30 30 6.0 0 0 83
0.0 0.0 0 0 0.05 0.00 29653.00 12983.57 7 0 0 0 2
10 1 2 0 5 0 0 0 275 19-AUG-2007 9:49
0 12834 10 13186 20 14099 30 15270 40 17281
50 20392 60 23300 70 24406 80 26209 90 27475
100 28336 110 28650 120 29064 130 29232 140 29405
150 29617 160 29646 170 29646 180 29628 190 29653
...
2460 652 2510 607 2560 574 2610 528 2660 501
2710 470 2750 445
EOS
NOTE: one file should have all the field sizes.
If not do:
cat PDD*EXP > AllPDD.exp
or
type PDD*EXP > AlPDD.exp
ConvertPTWDiagexp
Program to read a text file from PTW exp format to get the diagonal fan line data. Example data:
BEGIN_EXPORT
PTW-Freiburg Mephysto Export V.6.0
20-JUN-2008 9:36
BEGIN_GROUP ANAC20807
STANDARD PHOTONS CAX 1 1000 0.0 0 30 30 6.0 0 0 83
0.0 0.0 0 0 0.05 0.00 29653.00 12983.57 7 0 0 0 2
10 1 2 0 5 0 0 0 275 19-AUG-2007 9:49
0 12834 10 13186 20 14099 30 15270 40 17281
50 20392 60 23300 70 24406 80 26209 90 27475
100 28336 110 28650 120 29064 130 29232 140 29405
150 29617 160 29646 170 29646 180 29628 190 29653
...
2460 652 2510 607 2560 574 2610 528 2660 501
2710 470 2750 445
EOS
ConvertPTWAirexp
Program to read a text file from PTW exp format to get the diagonal in air fan line data. Example data:
BEGIN_EXPORT
PTW-Freiburg Mephysto Export V.6.0
20-JUN-2008 9:36
BEGIN_GROUP ANAC20807
STANDARD PHOTONS CAX 1 1000 0.0 0 30 30 6.0 0 0 83
0.0 0.0 0 0 0.05 0.00 29653.00 12983.57 7 0 0 0 2
10 1 2 0 5 0 0 0 275 19-AUG-2007 9:49
0 12834 10 13186 20 14099 30 15270 40 17281
50 20392 60 23300 70 24406 80 26209 90 27475
100 28336 110 28650 120 29064 130 29232 140 29405
150 29617 160 29646 170 29646 180 29628 190 29653
...
2460 652 2510 607 2560 574 2610 528 2660 501
2710 470 2750 445
EOS
ConvertRFA300DPFile
Program to convert scanditronix depth dose file from RFA300 to our format.
ADDED OPTION:
Add %RNOR to the file to convert to cGy/MU, For example:
%RNOR .00939
Value will multiply all further data below in file. Repeat as
needed.
:MSR 1 # No. of measurement in file
:SYS BDS 0 # Beam Data Scanner System
#
# RFA300 ASCII Measurement Dump ( BDS format )
#
# Measurement number 1
#
%VNR 1.0
%MOD
%TYP SCN
%SCN DPT
%FLD ION
%DAT 06-16-2010
%TIM 13:33:21
%FSZ 104 104
%BMT PHO 10.0
%SSD 1000
%BUP 0
%BRD 1000
%FSH -1
%ASC 0
%WEG 0
%GPO 0
%CPO 0
%MEA 1
%PRD 0
%PTS 350
%STS 0.0 0.0 350.0 # Start Scan values in mm ( X , Y , Z )
%EDS 0.0 0.0 -0.5 # End Scan values in mm ( X , Y , Z )
! [2010-06-16 13:33 Interpolation: Spline 1. mm, Smoothing: Le
! ast Square 10. mm]
#
# X Y Z Dose
#
= 0.0 0.0 349.1 23.2
= 0.0 0.0 348.1 23.3
= 0.0 0.0 347.1 23.5
= 0.0 0.0 346.1 23.6
= 0.0 0.0 345.1 23.8
...
= 0.0 0.0 3.1 60.5
= 0.0 0.0 2.1 53.8
= 0.0 0.0 1.1 47.9
= 0.0 0.0 0.1 43.6
:EOM # End of Measurement
:EOF # End of File
ConvertScandProDiag
Converts RFA300 scans to in water diagonal scan file.
Example file:
:MSR 4 # No. of measurement in file
:SYS BDS 0 # Beam Data Scanner System
#
# RFA300 ASCII Measurement Dump ( BDS format )
#
# Measurement number 1
#
%VNR 1.0
%MOD
%TYP SCN
%SCN PRO
%FLD SEM
%DAT 08-14-2009
%TIM 17:11:26
%FSZ 210 160
%BMT PHO 15.0
%SSD 1000
%BUP 0
%BRD 1000
%FSH -1
%ASC 0
%WEG 0
%GPO 0
%CPO 0
%MEA 2
%PRD 250
%PTS 319
%STS 0.0 -158.9 25.0 # Start Scan values in mm ( X , Y , Z )
%EDS 0.0 158.9 25.0 # End Scan values in mm ( X , Y , Z )
!
!
#
# X Y Z Dose
#
= 0.0 -158.9 25.0 16.6
= 0.0 -157.9 25.0 16.8
= 0.0 -156.9 25.0 17.7
= 0.0 -155.9 25.0 18.5
= 0.0 -154.9 25.0 18.9
= 0.0 -153.9 25.0 19.5
ConvertRFA3ScanFile
Program to convert Scanditronix RFA3 scan file.
ConvertScandPdd
Program to read Scandatronic PDD file and write data files out for the beam directory, converting the format. The Scandatronic PDD file must be edited slightly. Add number of fields. take out lines. Example file:
Rad Device: Seimens MD
Energy: Photon 6 MV
SSD: 1000.
Renormalisation: 15.0 mm
38
30. 40. 50. 60. 70. 80. 90. 100. 110.
etc..
ConvertScandProDiag
Program to convert scanditronix in water diagonal scan from RFA300 to our format.
Example input file:
:MSR 4 # No. of measurement in file
:SYS BDS 0 # Beam Data Scanner System
#
# RFA300 ASCII Measurement Dump ( BDS format )
#
# Measurement number 1
#
%VNR 1.0
%MOD
%TYP SCN
%SCN PRO
%FLD SEM
%DAT 08-14-2009
%TIM 17:11:26
%FSZ 210 160
%BMT PHO 15.0
%SSD 1000
%BUP 0
%BRD 1000
%FSH -1
%ASC 0
%WEG 0
%GPO 0
%CPO 0
%MEA 2
%PRD 250
%PTS 319
%STS 0.0 -158.9 25.0 # Start Scan values in mm ( X , Y , Z )
%EDS 0.0 158.9 25.0 # End Scan values in mm ( X , Y , Z )
!
!
#
# X Y Z Dose
#
= 0.0 -158.9 25.0 16.6
= 0.0 -157.9 25.0 16.8
= 0.0 -156.9 25.0 17.7
= 0.0 -155.9 25.0 18.5
= 0.0 -154.9 25.0 18.9
= 0.0 -153.9 25.0 19.5
ConvertScandOCR
Read Scanditonix OCR scan file. File has to be changed. Initial data header commented out, added are the lines:
/* energy*/ 6
/* field size */ 40
/* distance */ 100
/* number of scans */ 2
/* number of points */ 275
ReadOCRData
Read in two column of numbers, average duplicate results, right back out as tangent value. Program assumes this was from a scan symmetric about the cental axis at zero.
ReadOCRText
Program to read tabulated text data, radius versus signal, for X,signal in two input files, and produce an OCR table that can be copied into an in air OCR file.
ConvertScandProScan
Program to convert scanditronix scan file from RFA300 to a profile format.
Added Option: Add %RNOR to the file to convert to cGy/MU, For example:
%RNOR .00939
Value will multiply all further data below in file. Repeat as
needed.
Example input file:
:MSR 8 # No. of measurement in file
:SYS BDS 0 # Beam Data Scanner System
#
# RFA300 ASCII Measurement Dump ( BDS format )
#
# Measurement number 1
#
%VNR 1.0
%MOD
%TYP SCN
%SCN PRO
%FLD ION
%DAT 02-27-2006
%TIM 11:41:53
%FSZ 200 200
%BMT PHO 6.0
%SSD 1000
%BUP 0
%BRD 1000
%FSH -1
%ASC 0
%WEG 0
%GPO 0
%CPO 0
%MEA 2
%PRD 150
%PTS 182
%STS 0.0 -182.6 15.0 # Start Scan values in mm ( X , Y , Z )
%EDS 0.0 182.8 15.0 # End Scan values in mm ( X , Y , Z )
!
** March 19, 2008, 13:13 - Interpolation Method = Linear
! , Step = 2. mm, Smoothing Function = None
#
# X Y Z Dose
#
= 0.0 -182.0 15.0 1.9
= 0.0 -180.0 15.0 1.9
= 0.0 -178.0 15.0 2.0
ConvertWelPddOut
Program to read Wellhoffer PDD OUT files, write data files out to the beam directory, converting the format. Example of format
Crossplane: ,x-axis, 170, 0, 9999,
143, -1, -2,
143, 0, 0,
0, 0, 0,
10.0x10.0,
150,
-1500, 6,
-1480, 6,
ConvertWelDiagOut
Program to convert Welhofer scan Out files for in water diagonal data, X for 40x40 field size.
ConvertWelInAirOut
Program to convert Welhofer scan Out files for in air data, for 40x40 field size.
ConvertWelProScanTab
Program to convert Wellhofer profile scan file in table form.
ConvertWelProScanOut
Contents of this file: program to convert Wellhofer scan Out files.
ConvertcvsPDDFile
Convert % depth dose data in csv format written by OmniPro Accept software, reading the ratio column. Example format:
01/04/2012
16:52:49
Radiation
device:; TB 1133 Accelerator
Energy:; 6 MV
Controller:; CCU
Measurement
device:; NWP484841
Field
detector:; Thimble
Reference
detector:; Thimble
SAD:; 1000 mm
SSD:; 1000 mm
Field
size:; 100 x 100 mm
Gantry
angle:; 0
Measurement
medium:; Water
Scan type:; Beam
Scan mode:; Continuous
Points
[mm]:
Inline; Crossline; Depth; Normalized field; Current field; Ratio
0.0; 0.0;
-0.6; 0.0; 0; 58.5
0.0; 0.0;
-0.5; 0.0; 0; 58.9
0.0; 0.0;
0.6; 0.0; 0; 62.2
0.0; 0.0;
0.7; 0.0; 0; 62.9
0.0; 0.0;
1.8; 0.0; 0; 68.5
0.0; 0.0;
1.9; 0.0; 0; 69.3
0.0; 0.0;
3.0; 0.0; 0; 76.6
0.0; 0.0;
3.2; 0.0; 0; 77.5
0.0; 0.0;
4.2; 0.0; 0; 84.4
0.0; 0.0;
4.4; 0.0; 0; 85.1
0.0; 0.0;
5.4; 0.0; 0; 89.8
0.0; 0.0;
5.5; 0.0; 0; 90.3
ConvertcvsDiagFile
Convert profile data in csv format written by OmniPro Accept software. Example format:
02/04/2012
20:42:55
Radiation
device:; TB 1133 Accelerator
Energy:; 6 MV
Controller:; CCU
Measurement
device:; NWP484841
Field
detector:; Thimble
Reference
detector:; Thimble
SAD:; 1000 mm
SSD:; 1000 mm
Field
size:; 400 x 400 mm
Gantry
angle:; 0
Measurement
medium:; Water
Scan type:; Crossline
Scan mode:; Continuous
Points
[mm]:
Inline; Crossline; Depth; Normalized field; Current field; Ratio
0.0;
43.0; 14.0; 93.8; 241510; 93.2
0.0;
42.3; 14.0; 92.7; 238895; 93.3
0.0;
40.9; 14.0; 93.4; 240684; 93.4
0.0;
39.8; 14.0; 94.1; 242360; 93.9
0.0;
38.6; 14.0; 94.7; 243848; 94.4
0.0;
37.4; 14.0; 94.5; 243440; 94.6
0.0;
36.2; 14.0; 95.6; 246250; 94.9
0.0;
35.0; 14.0; 94.5; 243331; 95.4
0.0;
33.7; 14.0; 95.9; 247145; 95.5
0.0;
32.6; 14.0; 96.2; 247739; 95.7
0.0;
31.4; 14.0; 95.4; 245780; 96.0