Dosimetry Check (DC) Operating
Manual
28 July 2015
Math Resolutions, LLC
support@MathResolutions.com
Copyright 2000 – 2015 by Math Resolutions, LLC
U.S. Patents 6,853,702, 8,351, 572, 8,605,857
FDA 510K K010225, K101503, K132605
Import
of the Treatment Plan in Dicom RT
Set
Up Patient Model for Dose Computation.
Specifying
Calibration for Automation
Enter
the monitior units you will use for calibration images
Process
a calibration image for IMRT or IMAT
Select
the EPID kernel file to use
Use
of the Inclinometer Program
Manual
Processing of EPID Images
Processing
IMAT Image (RapidArc, VMAT)
Specific
Dosimetry Check Functions
Reference Manuals
Reference
manuals are on the www.MathResolutions.com
website, also accessible from www.DosimetryCheck.com. There is also a search button at the top of
web pages that will search the entire website.
An
overview is provided here sufficient for normal operation. Refer to the reference manuals for
details. The program is automated
throughout but options are provided for manual operation.
Dosimetry
Check is an X/Motif program, native to UNIX/Linux, and will run on Windows with
a third party X server.
Import of the Treatment Plan in Dicom RT
Export
the treatment plan to a designated directory (folder). You must export the CT scans, the structures
file, the plan file, and the three dimensional dose file.
Number of Fractions
It
is your choice in the planning system whether or not to export the dose for one
fraction or for many. DC will pick up
from the Dicom RT download whether the dose is being shown for one fraction or
many. If more than one, DC will multiply
the dose it computes by the number of fractions and compare that to the
imported dose from the planning system.
The number of fractions is shown on the Plan Toolbar and can be changed:


![]()
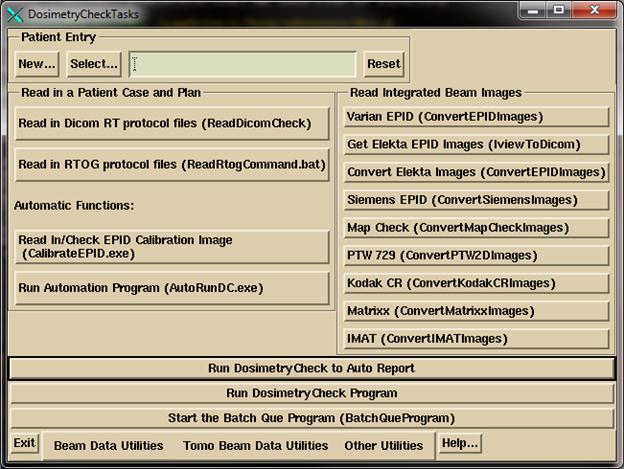
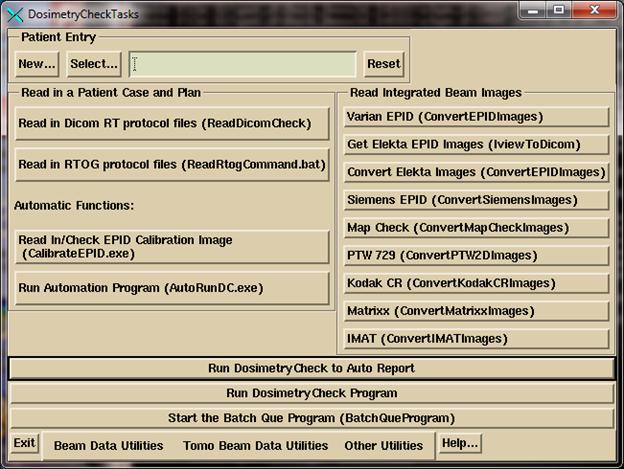
Click
on the DosimetryCheckTasks (DCTasks) icon on the desktop and select program
ReadDicomCheck or run the same directly.

If
run from DCTasks, the program writes out to a log file rdcstdout.log. If from a command prompt window you will see
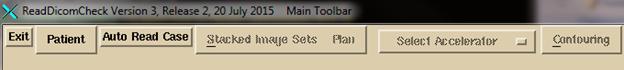
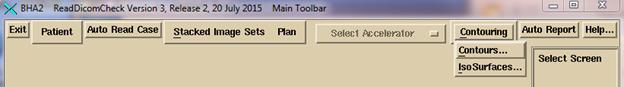
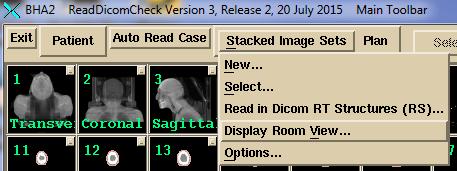
the same written to the window. The
ReadDicomCheck toolbar is shown below:
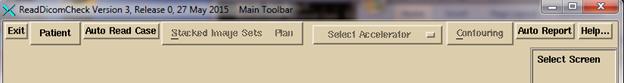
For
normal operation, hit the “Auto Read Case” button.

You
will get a file selection dialog box for selecting a single directory:

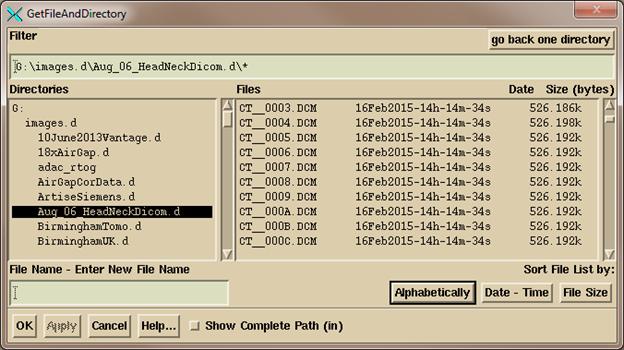


Navigate,
either by typing in a path in the Filter box (always end the path with a wild
card *. R* would show all files starting
with the letter R for example) or use the Directories tree on the left to
navigate where the plan down load is where you see the files on the right, and then
hit the “OK” button.
The
program will create a directory (folder) in it’s patient’s directory with the
directory name made from the patient’s name in the Dicom RT plan file and with
the patient ID appended to the directory name.
It is important to generate the name from the plan file as the automatic
function will be looking for the same exact name and ID in the EPID Dicom files
to associate the EPID files with the patient.
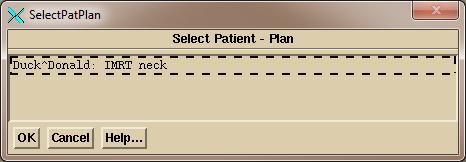
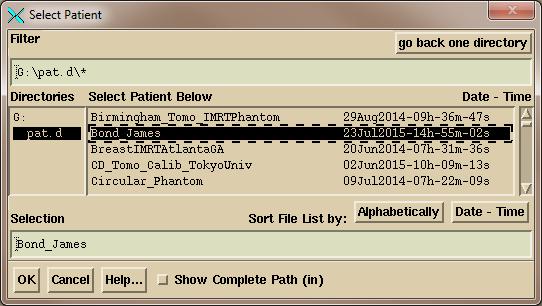
The
program will display all patients and plans found in the above selected
directory and you will have to pick one (only one shown in the below example)
by clicking on the choice and then the OK button.


If
the accelerator name in the plan is not the same as in Dosimetry Check, you
will have to pick the accelerator with the “Select Accelerator” option menu (an
option menu is a pull down menu that shows the current choice, like font name
and size in Microsoft Word).
Manual Import
If anything goes wrong, you can select files
manually. On some rare occasions, for
example, the plan might not properly identify the CT scans that belong to the
plan. To do manually, select or create
the patient under the Patient pull down.
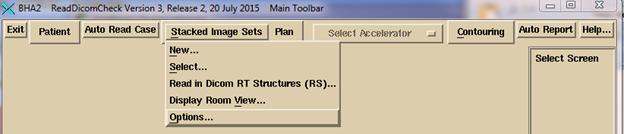
The program is designed for all plans to be under the same patient
name. Under the “Stacked Image Sets”
pull down
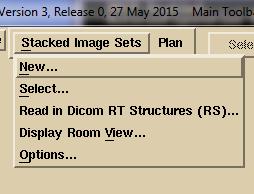
either
select an existing image set if one was already read in for the plan, or select
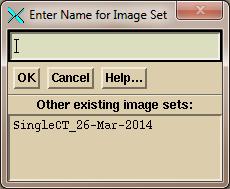
New to read in a new one. A stacked
image set is any set of CT scans (or MRI scans) that together are related
geometrically from which a three dimensional model of the patient can be
constructed. If reading in a new stacked
images set, you will get a popup asking you to type in the name of the stacked
image set, while showing any existing image sets:


You
will then get a file selection popup.
Navigate to where the CT scans are and select them.

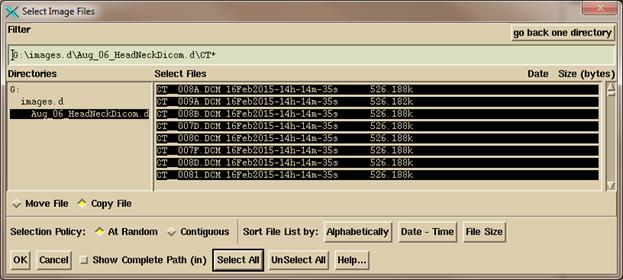
You
can use the Filter to display only files startding with the letters CT, then
click on “Select All”. Or you can simply
click the mouse on each CT scan file.
Use “At Random” to select files
that might be separated in a list. Use
“Contiguous” to select a range by clicking on the first file, then while
holding down the shift key click on a file at the other end of the list. Note that you can arrange the files
alphabetically, by date and time, and by file size. Click on the “OK” button to continue.
After
reading in the CT scans, select to read in the structures file. On the file selection popup, select the
structures file (which usually starts with RS).
Then
on the Plan pull down:
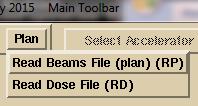
select
to read in the plan file first, then the dose file second. In this manual selection mode, the program
will only issue a warning if the CT scans are not related to the plan.
Reloading a Prior Plan
You
can reselect a plan already read in. The
program will overwrite the plan data and delete any prior computed dose. To reload the plan, select the patient and
the stacked images set. Then select the
plan. To reload the plan dose you have
to read in the plan file first.
Set Up Patient Model for Dose Computation
It is
next necessary for you to be sure that there is a designated ROI (region of
interest outline) that represents the external contour of the patient,
separating patient from non-patient. Some
planning systems such as Pinnacle and TomoTherapy do not require such an
external contour. DC does. Most planning system including Pinnacle, Eclipse,
XIO, and RayStation will export the external contours and label them as such in
the Dicom header so that DC detects which ROI is the external contour and so
will pick up that designation automatically.
Otherwise use the DC contouring package to create an external contour
automatically or manually. See the
System2100 reference manual under “Outlining Regions of Interest” section for
details on how to use the contouring package.

The
Contouring Toolbar:

Be aware that the Dicom RT
standard only covers how contours are transmitted, not how volumes are made out
of those contours. For example:
- By default in DC, inside contours are not holes
in the created volume. You have to
turn that on for an ROI volume.
- The average density is used for two or more ROI’s
that intersect at a point. There is not a concept of one ROI inside
another.
- By default shape interpolation is turned on in
Dosimetry Check (interpolating the shape between coplanar contours that
are more than 1 mm apart).
- Contours may be in planes other than the
transverse plane.
- The process in DC is to voxel map the volume,
then to generate a 3D triangulated surface. The voxel map determines the
volume. There may be differences
for contour lines running through a voxel as to whether the voxel is in or
out of the volume. The surface is
used only for display.
- DC has the additional feature of generating three
dimensional isosurfaces, but volumes are not generated from
isosurfaces. They are used for
display only, such as bone.
You
must review the coach model from the plan, or create one in DC (you can make and
use a template). If a separate ROI was
used for inside couch top and outside, you must create a third ROI using the
combine volumes tool (“New Volume from Old” on the “Volume” pull down on the
Contouring Toolbar) to make a new couch top from the other ROI minus the inner
ROI, and delete the formers. See the
“Outlining Regions of Interest” section in the System2100 manual and the “Stacked
Image Set: skin, density” in the DC
reference manual.
All
ROI’s that are to be assigned densities must be done so (but assignments are
imported from the planning system, except for CMS XIO because XIO incorrectly
marks all ROI volumes not assigned to have been assigned the density of
one). The program will display a pop up
showing ROI’s that have an assigned density from the planning system when the
structures file is read.

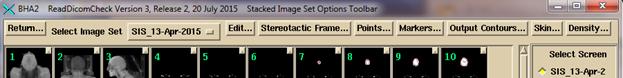
Use
the Stacked Image Set Options Toolbar to select skin boundary, select CT number
to density curve, and pick specific points for calculation.
For
further details on ReadDicomCheck, see the “Dicom RT Download” section of the Dosimetry
Check reference manual.
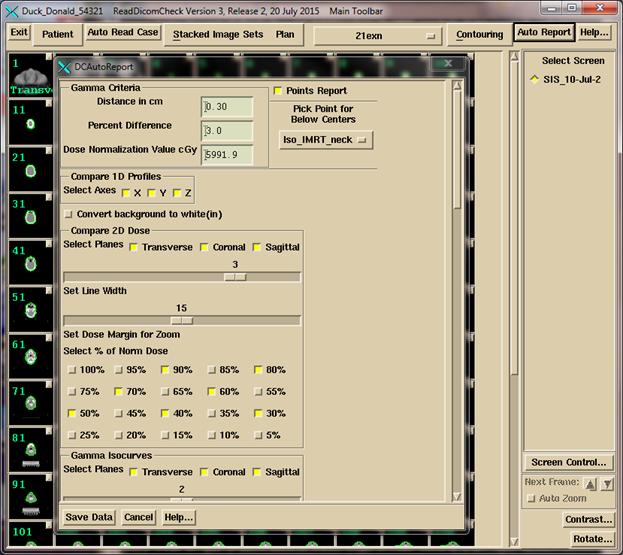
Set Up for the Auto Report
After
the patient model is correct, select “Auto Report” to review selections. After making your selections click the “Save
Data” button. This must be done for the
automation program to be able to generate a report.


For details see the Plan section of the
Dosimetry Check reference manual.
Select the
gamma criteria values (distance in cm and percent difference) including the
dose to compare to (what the percent is of).
The program will default to the plan dose at the average isocenter of
all the fields.
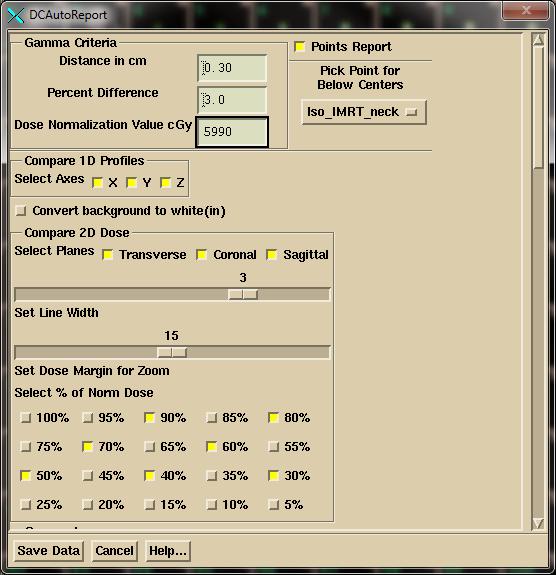
Note
that if the normalization dose is 100 cGy, then in a low dose region, the
difference between 11 cGy and 10 cGy is 1%, not 10%. This is a basic concept for evaluating and
comparing plans.
Then select a
point (normally isocenter) that all the generated planes and line plots are to
go through.
Then select
desired dose values (% of the normalized dose) to plot on the dose comparison
isodose plots.


 Next select the structures
to show gamma values in the gamma volume histogram:
Next select the structures
to show gamma values in the gamma volume histogram:

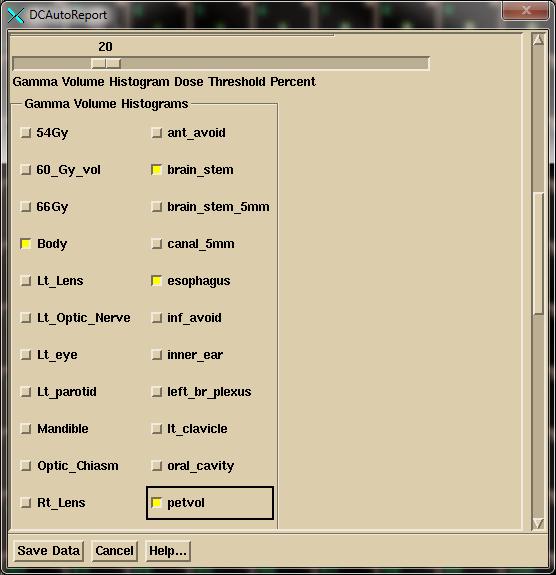
Then select the region of interest (ROI) volumes for the dose
volume histograms. An ROI volume is the
volume generated from the contours of that volume.

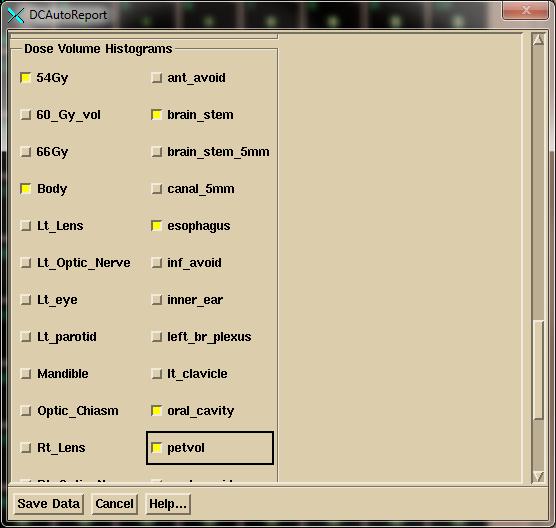
Note that the program will remember your choices. If you consistently name volumes the same way
the program will default to those names.
Viewing the Patient in 3D
View
the patient and couch model in 3D to verify.
For viewing the patient model in 3D see the “3D Views” section of the
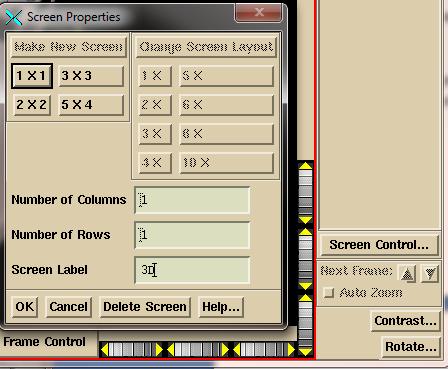
System2100 manual. Click the mouse on
the “Screen Control” button on the bottom left of the main application. You will get the popup shown below. Select “Make New Screen”, then select the
layout which specifies how many frames are to be in the screen. Enter a label
for the screen you are making and then click on the OK button.


On
the new screen, click the mouse on the frame to select that frame for the next
image.
Select
to “Display Room View”:

![]()
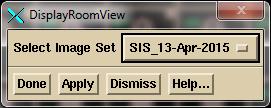
Note
that in general, if you have read in more than one stacked image set, you will
need to select the stack image set from the option menu. Click on the “Done” button to create the 3D
view in the selected frame for the selected stacked image set.
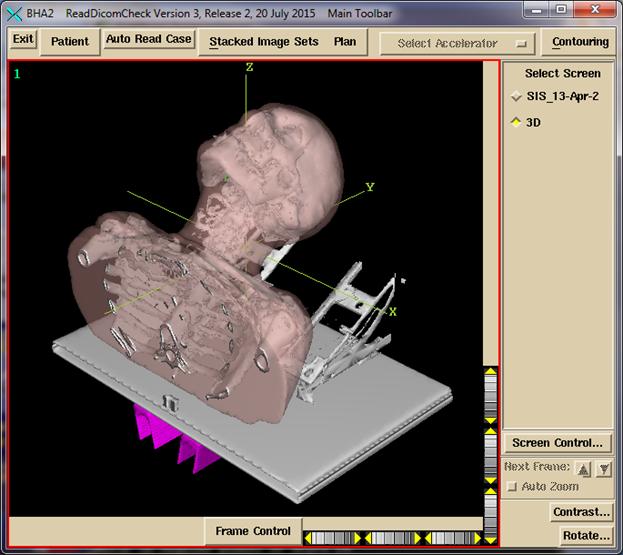
Shown
below is an example of 3D view of a patient model, with the external surface shown
transparent 64%, a bone isosuface (not from contours, where external hardware
was also picked up), a couch top model, and a couch rail model. Rotate the view to be sure the couch top is
hollow inside if that is the desired case.
Use the wheels around the edge of the frame or drag the mouse. The wheel widget may be dragged beyond the
wheel. The yellow triangle is clicked on
for single steps.


Automatic Processing
Automation
is set up by defining three folders for each EPID to be monitored: a calibration folder where the calibration
image file is to go (never used for TomoTherapy), a pre-treatment folder where
pre-treatment image files are to go, and an exit folder where exit image files
are to go. You should always deposit the
calibration image file first. The
program cycles through the three folders and then waits. Some time lapse between the calibration
deposit and the clinical files might be needed to guarantee that the
calibration file is processed first.
Export
the EPID clinical image files (on in the case of TomoTherapy the Dicom detector
file) to the pre-treatment or exit monitored directory (folder). You will get either the completed auto report,
or a pop up of the log file as to why the report could not be processed and
generated. The program has no way to
tell the difference between pre-treatment images or exit images other then the
folder those image files are deposited into.
See
the “Automatic Processing of EPID Images to Dose Comparison (Auto) Report”
manual to set up for automatic processing, and for its limitations. You must start the auto run program or you
can add this program (AutoRunDC) to start when the computer is booted:

TomoTherapy
For
TomoTherapy, only the Dicom export of the detector file can be placed in a
monitored directory. The binary file
that is not Dicom cannot be processed automatically because it contains no
other information such as the patient’s name.
For the binary files, you must run Dosimetry Check and select to read in
the binary only file (under the Beams pull down on the Plan Toolbar, or under
Options on the Beam Toolbar).
Specifying Calibration for Automation
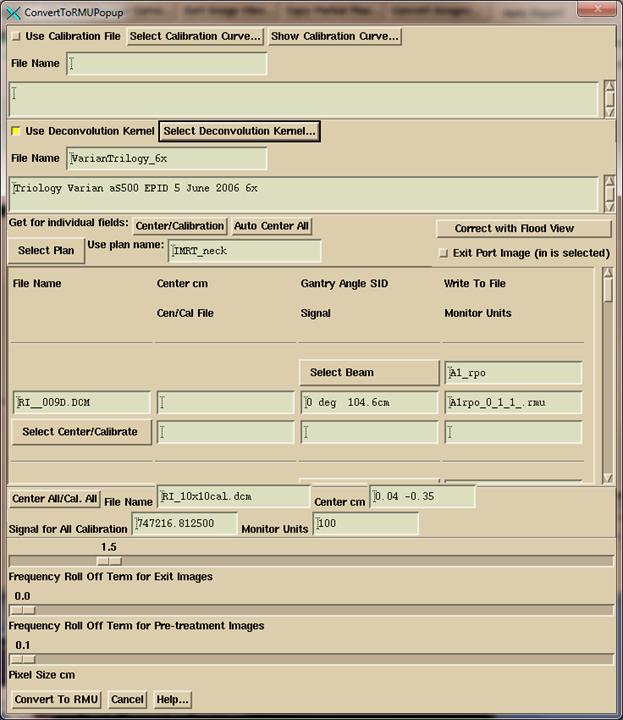
IMRT (Intensity Modulated Radiation Therapy) integrated images and IMAT (Intensity Modulated Arc Therapy) integrated images such as RapidArc (Varian) or VMAT (Volumetric Arc Therapy) are calibrated relative to monitor units by a calibration image for known monitor units. The calibration image is typically a 10x10 cm field size for which the definition of the monitor unit has been stated in terms of a field size, distance to the surface, depth, and dose rate in cGy/mu in the beam data directory in the file “Calibrationnn” where “nn: is the nominal energy such as 06. The calibration image is integrated in air with nothing in the beam.
You
must specify the EPID deconvolution kernel to use, and the monitor units that
will be used. Then you can put a
calibration image into the monitored calibration folder for automatic
processing, or also process it below.
For IMAT when the calibration image is spread out over more than file,
then you must enter those images here as the monitored calibration directory
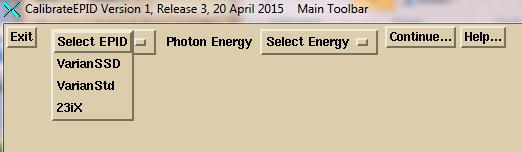
will only use the newest file. Select the EPID calibration program to do
this:

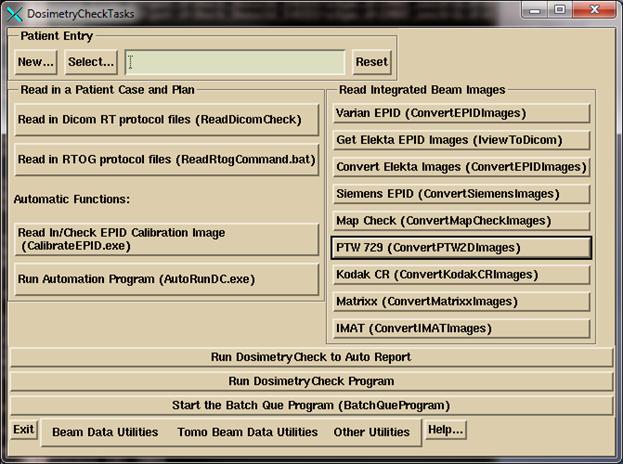
Select the specific EPID:
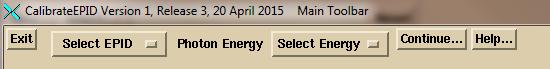


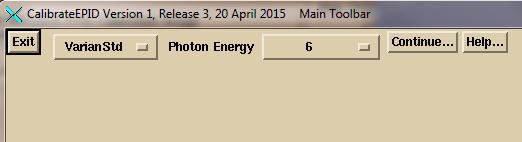
Then select the energy:

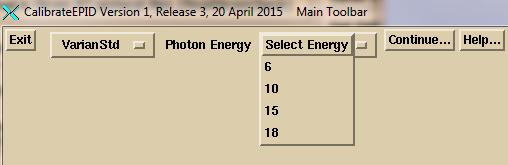
then click the mouse on the “Continue” button:

Enter the monitior units you will use for calibration
images
Enter the monitor units you are using for your calibration
images in the text box.
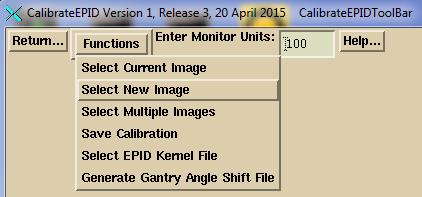
Process a calibration image for IMRT or IMAT
To process a calbration image here (you can also just put it
in the monitored calibration folder) select “Select New Image”. However, for multiple images of calibration
image taken in cine (contiuous) mode, you must process those images here as the
monitored folder will only use the newest image and ignore the rest. The program will add up the multiple images.


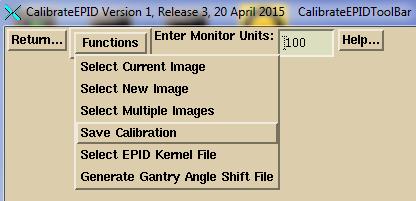
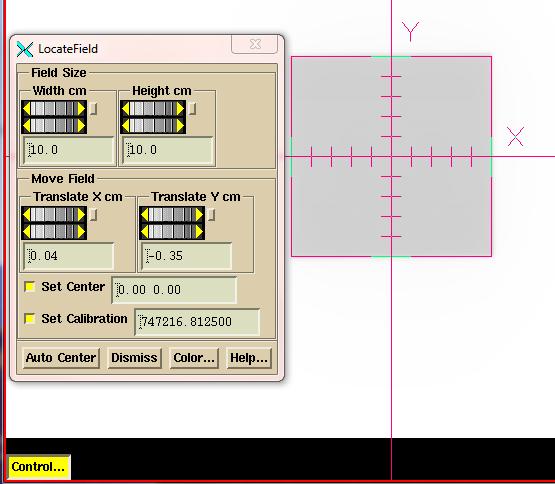
Review
the centering and adjust if necessary. See
below for ConvertEPIDImages for more on the centering tool. Then save the results by selecting Save on
the Functions pull down menu:

Select the EPID kernel file to use
You
must select the EPID kernel file to be used.
Select “Select EPID Kernel File” on the Functions pull down.

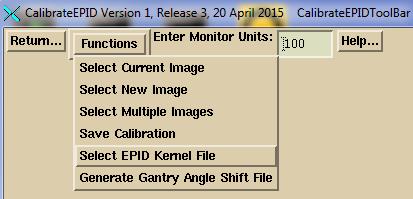
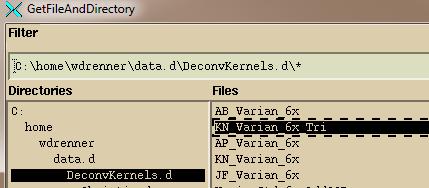
Select
the EPID kernel file from the file selection dialog.

Elekta EPID iViewGT Images
There
is no Dicom standard for encoding an integrated image. Varian uses a comment statement
or in the case of their portal dosimetry they use CT codes originally meant for
Hounsfield
units. Siemens uses a private code. And at the present writing, Elekta does not export integrated
images in Dicom format. By integrated
image, we mean that the pixel values get larger the longer they are exposed,
with zero for zero radiation exposure.
EPIDs capture images of the order of 5 to 8 frames per second, and the
frames are all averaged to display an image.
However, if the number of frames is known, one can multiply the image
pixel values by the number of frames to get an integrated pixel value (this
will be after contrast reversal so that white is more radiation).
Program IviewToDicom
Program
IviewToDicom was written to go into the iViewGT data base and pull out
information along with the image to then write out a Dicom RT image file. See “Using the Elekta iViewGT Imaging System”
manual for details on how to set up and run this program.
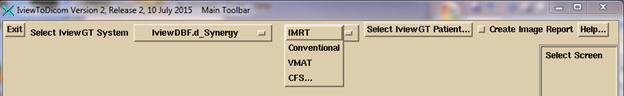

First
select the iViewGT system with the first option menu on the left. This list is created by the file IviewGTDirectory.loc
in the program resources directory. Then
you have to select the type of image on the next option menu. iViewGT will have stored these images
differently.
IMRT
mode is non-rotating intensity modulated beams.
Conventional would be a simple open field such as the 10x10 calibration
image. VMAT are images taken in cine
mode during beam on while the machine is rotating around the patient. You want to get an image about every 5
degrees. CFS mode is a mode where all
fields are treated automatically but the images are under the name of the first
field treated. For CFS mode, you will
have to select the plan so that the program can figure out which image belongs
to which beam.
Then
click on the “Select IviewGT Patient” button.
The program will display the list of patients found in the iViewGT data
base. Lastly, there is a “Create Image
Report” toggle button. If you select
this first before selecting a patient, you will get a report on all images
found in the data base.
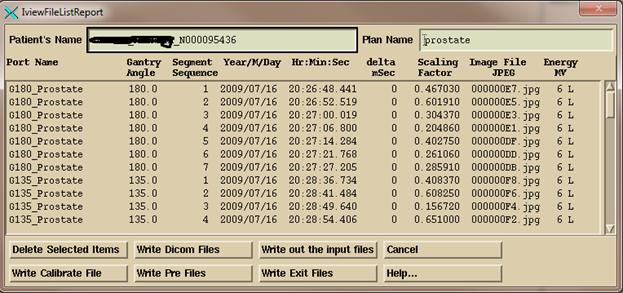
After
selecting the patient, you will get a pop up showing the latest integrated
images for a plan found for that patient.
Select to write out the images to the appropriate monitored folders for
automatic processing. The program will
format the image in a Dicom file and so that the other utility programs in DC
can recover the integrated pixel values.


The
bottom row of buttons will deposit the Dicom image file in the calibration
folder monitored by AutoRunDC, or the pre-treatment monitored folder, or the
exit monitored folder. For VMAT, as
described below, you will be prompted to select an inclinometer file for each
arch, and that file will be added to the folder with the respective Dicom image
files for that arc.
The
“Write Dicom Files” button will output the images to the folder named by the
program resource file NewEPIDImagesDirectory.loc instead of a monitored
folder. “Write out the Input files” will
write out copies of the data base files from which information is being extracted
from in the iViewGT data base for the purpose of figuring out any problem that
might occur.
Inclinometer file for Elekta
With Elekta for VMAT, images are integrated while the
machine rotates around the patient, but there is only a time stamp for each
image. Elekta does not provide the gantry
angle in cine mode during VMAT delivery in their data base. To assign a gantry angle to those images an
inclinometer must be mounted on the LINAC and a program that we can provide to
write out a file of time versus gantry angle.
Further, to minimize any impact on the iViewGT computer that program can
go on a memory stick. The file produced
by the inclinometer program must be included with the processing of the EPID
images so that a gantry angle can be determined for each image using the time
stamp to look up the gantry angle. The
file can be selected along with EPID images or selected manually for processing. The Program IviewToDicom above will prompt
you to select the inclinometer file for each beam and will put that file in
with the EPID image files. See “Using the Elekta
iViewGT Imaging System” manual for details on how to set up and run this
program.
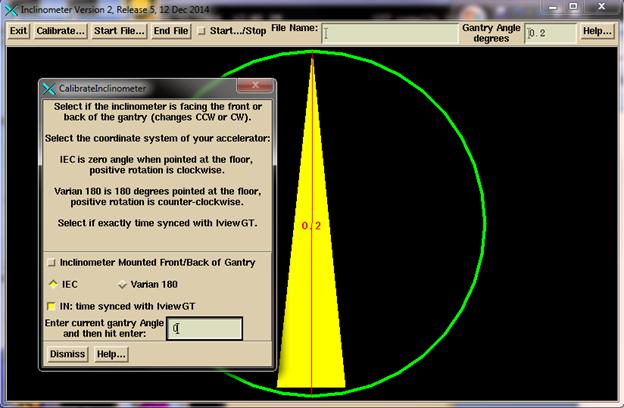
Use of the Inclinometer Program
Hit
the Calibrate button to calibrate the inclinometer. Then type in the current gantry angle. Rotate the gantry to be sure that image is
rotating in the same direction. If not
reverse the mount selection on the calibration popup.
Select
“time synced” if the program is running on the iViewGT computer or if the
computer is timed synced to the iViewGT computer. With time synced the gantry angle is looked
up directly from the time (but first adjusting the time to the middle of the
integrated sub-arc). Without time sync, the
program will look for the start of gantry movement to establish the time that
the beam went on. This information is
saved for the next use.
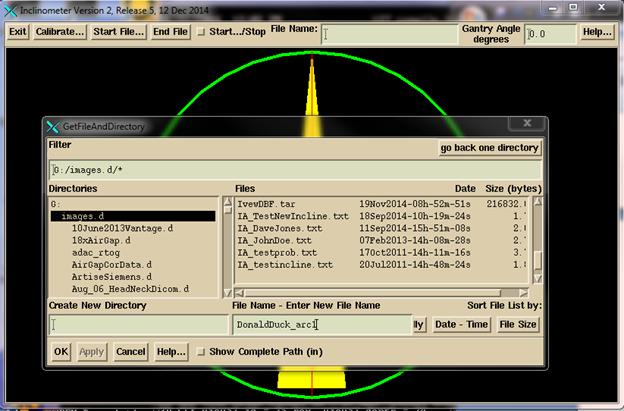
Click
the “Start File” button, navigate to where you want the inclinometer file to
go, and enter a name to associate with the patient and the arc. The program will add IA to the front of the
file name and .txt at the end. You can
leave the program running for more than one arc if in time synced mode.
Hit
the “Start-Stop” toggle button. Data
will be written to the file until you hit “End File” or untoggle the “Start-Stop”
toggle button and the file will be closed.
A new file must be started for another arc.
Manual Processing of EPID Images
See
the separate “Converting EPID Images” and “Converting IMAT Images” reference
manuals for more details then shown below.
Processing of IMRT Images
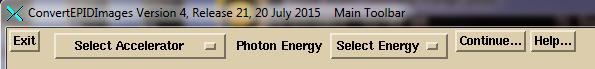
Run
program ConvertEPIDImages from DosimetryCheckTasks. On the first toolbar, select the accelerator
with the option menu and then the energy.
Then hit the continue button:
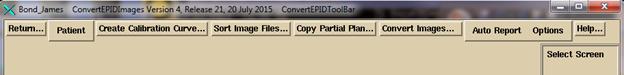
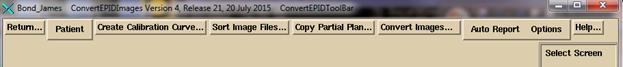
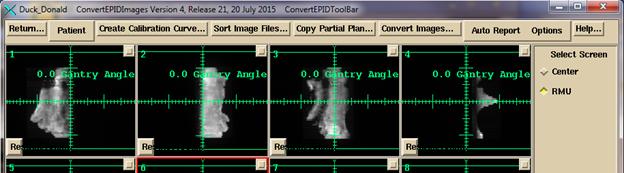
On
the Convert EPID ToolBar, hit the “Patient” button to select the patient from
the patient selection dialogue. (Note
the patient can also be pre-selected from DosimetryCheckTasks).
Select
the patient on the right and hit the OK button:
On
the ConvertEPIDToolBar you have several options.
Use
the “Sort Image Files” button to select a folder of images to have those images
sorted into sub-folders by patient name, energy, and image label.
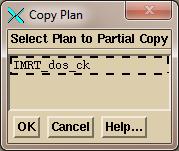
Next,
you may very well want to copy the downloaded plan to make a separate plan
entry for this particular trial. A trial
being the computed doses for a set of EPID images. The automated functions always does this,
appending the EPID date to the plan name.
You will be prompted to select the plan to copy:
And
then to type in a name:
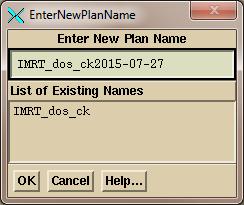
Here
the current date will be appended by default, and you can override the name to
be used.
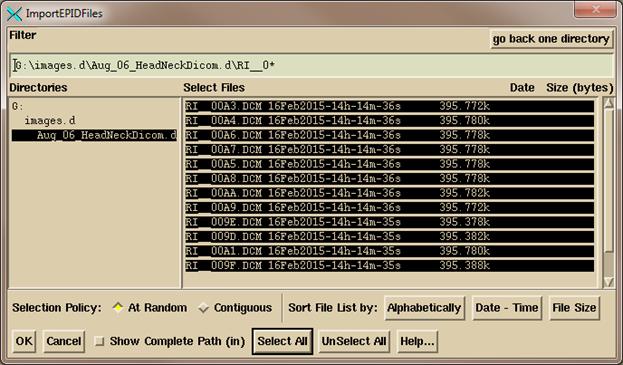
Then
click on the “Convert Images” button to get a file selection dialogue to select
the files to be converted. The files you
select must be for the same patient plan.
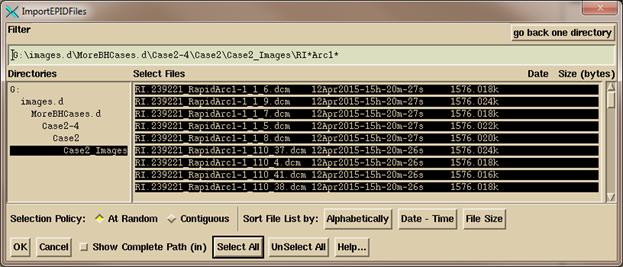
On
the files selection dialogue below, select the files for the plan. But you can only convert one energy at a
time. The program will reject image
files not of the energy that you selected above. Note that you can set the filter line to only
show the image files you want to select.
Hit “Select All” or manually select the files. “Contiguous” will let you select the first
file and all the ones between that and a second file by holding down the shift
key. Then hit the OK button.
The
selected files will be read in, and you will then get the convert pop up shown
below. The files read in will be listed
in a scrolled area in the middle of the pop up.
You have to be sure the correct plan is selected and the correct beam is
selected for each image. If more than
one image is selected for a beam, then they will be added together (such as the
case of a multi-leaf carriage shift).
You must be sure that the correct EPID kernel is selected. If you untoggle the EPID selection, the
images will only be normalized to the calibration image without any further
processing. A calibration image must be
selected. There can be a single
calibration image selected for all the images, or a calibration image to be
used with each individual image.


If
you select the calibration file with the image files, and the calibration file
has the letters “cal” in them, the calibration file will be automatically
picked up at that time. Otherwise select
it manually.
The
“Select Plan” pull down acts like an option menu in that the current choice is
shown in a text box. You can type in a
plan name that you have not downloaded yet but then you will have to type in a
name for each beam. If you leave the
plan text box blank, the program will not assign the images to any plan. In either case, the processed images are not
directly assigned here to the plan. They
are put into in a folder called FluenceFiles.d in the patient’s folder. Upon running Dosimetry Check, the images will
be incorporated automatically if none have been specified yet. If the plan already has images, then you will
be asked if you want to incorporate the newly processed images to replace the
prior. In contrast, the automated
function above will put the image directly into the trial plan that was
created.
The
exit toggle button is the only place where you designate that the images were
taken with the patient in the beam. The
patient model must be complete with all assignments of density to region of
interest (ROI) volume, a couch model etc.
The patient model and EPID deconvolution kernel will be used here to
convert an exit image to the in air fluence before the patient and delivered to
the Dosimetry Check executable. From
that point forward there is no difference between the exit and pre-treatment
images. The images will be converted to
the units rmu which stands for relative monitor units.
RMU Definition
An
rmu is the monitor units that would deliver the same radiation intensity on the
central axis of the calibration image (normally designated to be 10x10
cm). For open fields, the rmu would be
the monitor units times the collimator scatter factor. In this manner the in air fluence is
normalized to monitor units.
Be
sure to review the calibration image for proper centering. Hit the “Control” button to bring up a tool
to manually find the image center.
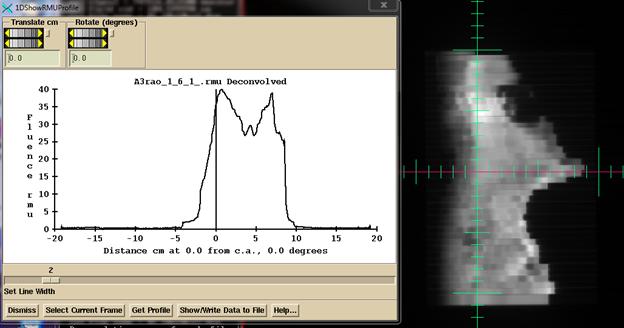
When
done with all choices, click the “Convert to RMU” button. After conversion, the converted images will
be shown. Then note the tools under the
Options pull down on the ConvertEPIDToolBar to look at the rmu value and
profile. For testing with known fields,
this is a good place to determine if you are getting the correct rmu
value. If the rmu value is wrong, the
dose will be wrong.
You
may then hit the “Auto Report” button shown below to submit the plan for
computation and display of the auto report, assuming you had set that up when
you ran ReadDicomCheck or some other time for this plan.
Processing IMAT Image (RapidArc, VMAT)
You
begin as you do above for IMRT images.
The main difference is you process the images for only one arc (beam) at
a time. So only select the images for a
single arc. Below we have selected all the images for a single arc in the files
selection box. Note the use of the
Filter box to select to display only the Arc1 files. Otherwise select file one at a time or use
the “Contiguous” choice to select a range of inclusive files. Note also files can be displayed in
alphabetical order, or by date and time.
Be sure to select the correct beam (arc) for the images being processed.

Click
on the OK button when you have navigated to the directory and selected the
images for an arc. There are then some
differences in the convert popup that you get from the ConvertEPIDImages
program:


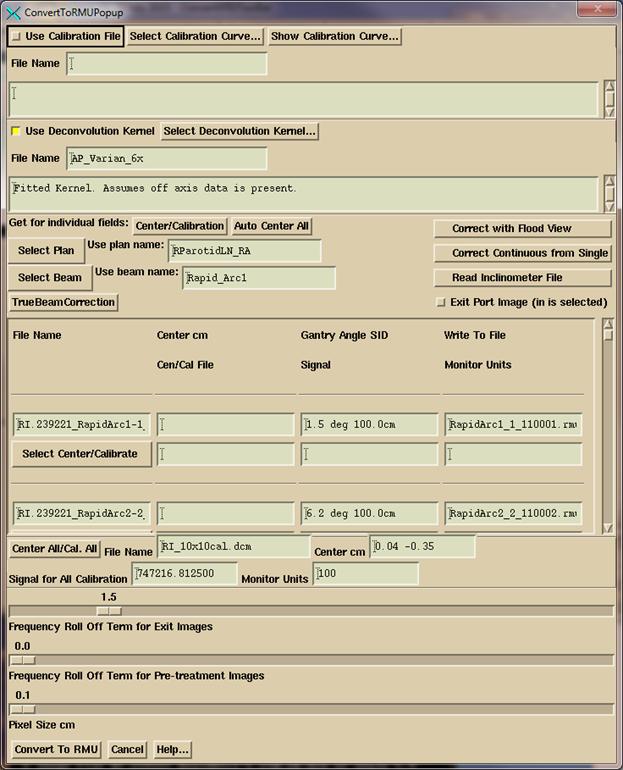
You
must select the plan and then the beam that the images are for. As in the IMRT convert popup, you can also
type in the plan name and beam name in the corresponding text box that shows
your selection if you have not downloaded the plan yet (but the patient entry
must exist, and to process exit images, you must have the plan). The pull down menu coupled to the text box
simulates an option menu but with the option to type in something
different. If no plan or beam is
selected, the images will just go to the FluenceFiles.d folder in the patient’s
folder under the IMAT sub-folder and you will have to manually select the processed
files from Dosimetry Check from the Beam Toolbar under the Options pull down.
If
the inclinometer file is needed for Elekta and was not included with the
selected images, then you must select to read it in.
For
Varian TrueBeam machine with operating version before 2.5, you must hit the
TrueBeamCorrection button to correct both the clinical images and the
calibration image gantry angle and source image distance (SID). The gantry angle will be off 90 degrees (90
needs to be added to all angles), and the SID will be incorrect.
Other
functions are covered in the reference manual.
Dosimetry Check
The
Dosimetry Check executable is run for manual non-automated operation. You can generate your own report using the
dose comparision tools. Specifics and
details are covered in the System 2100 manual and the Dosimetry Check
manual. System 2100 provides the
underlying image display functions, region of interest outlining, image fusion,
and sterotactic functions. Dosimetry
Check provides the functions specific for the quality control of treatments
with the reconstruction of dose from measured radiation fields and comparison
to the planning system dose.
Toolbars and Screens
The
program is organized with toolbars, the toolbar being pull down menus, push
buttons, and text boxes across the top of the application. Each toolbar has a name that is displayed. A return button on the left will return to
the prior toolbar. A map of the tools
bars is shown in the Dosimetry Check reference manual.
Below
the toolbar is a screen that shows images.
The screen is divided into individual frames. Each frame can display a 2D image or a 3D
solid model with light model image. If
there are more rows than columns of frames, the screen will be scrolled. There is a button in the upper right hand
corner of each frame. Hitting that
button will display that frame in the entire screen area, or return to showing
all the frames. When a single frame of
the screen is shown, in the lower right hand corner are arrow buttons that will
allow you to step through all the images on the screen one frame at a
time. By reformatting a stacked images
set in coronal or sagittal frames, one can step through those images. For tools that do not fit on a toolbar, a
popup is used instead. The main application
window and all pop ups can be resized.
Toolbars and pop ups have help buttons that will display text about the
current functions available on the toolbar or pop up.
On
the right of the main application windows will be a list of all the screens,
each of which can be selected to be viewed.
Shown below is an example showing the screen that contains a stacked
image set of CT scans.
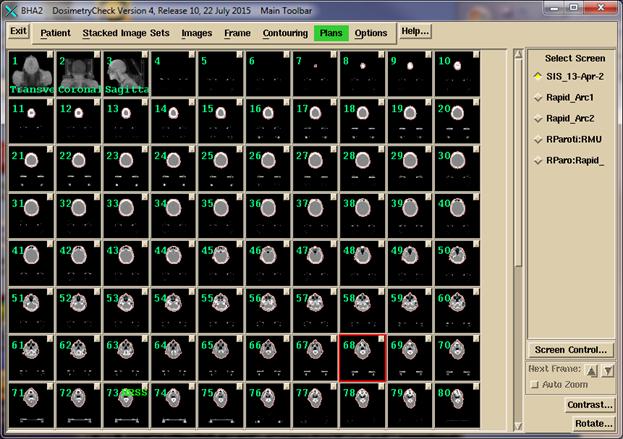
In
the above example, screens below the current stacked image set shows the images
for arc 1 of a plan, arc 2, an empty screen reserved for IMRT beams of a plan,
and a default view of a plan in a transverse, coronal, sagittal, and 3D view.
The
“Screen Control” button is for manually creating a screen or changing its
arrangement. “Contrast” for adjusting
the contrast of 2D images, and “Rotate” for finer controls for 3D images. The current image that these and many
controls operate on is the frame outlined in red, the current frame. Clicking the mouse on a frame makes it
current. Middle mouse will zoom in
(center where you clicked the mouse), right mouse out. For 3D images, wheels will rotate and move
the display, or you can drag the mouse.
Below
the latter screen is selected to be displayed and the Plan Toolbar has also
been selected:
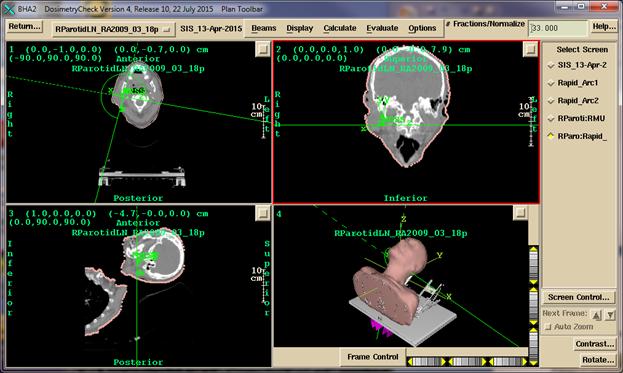
The
program has options to create any combination of images within the frame work of
screens divided into frames. More than
one plan for a patient may be read in and displayed at the same time. One must pick which plan is to be displayed
into which image. See the System2100
reference manual for more details on image display.
Printing images
Clicking
the mouse in a frame (to key keyboard focus on that window) and then hitting
the P key on the keyboard will bring up a pop up with the image and options to
add descriptive text and to either print (converting first to a pdf file), or
add to a print que to make a multi-page document. See the System2100 manual for details.
Specific Dosimetry Check Functions
Specific
functions of Dosimetry Check are covered in detail in the reference
manual. The dose and comparison of dose
may be done for specific points, dose compared along a profile, dose compared
with isodose curves, dose compared with the gamma method, dose volume
histograms compared, and gamma volume histograms generated.