Contents
Hardware and Operating System Requirements
IEC 60601-1 Medical electrical equipment
Start Up, Shut Down: Dosimetry Check Tasks
Toolbar Organization and Layout
Broad Considerations in the Use of this Program
General
Quality Control Principles
Possible
False Positives: Common Errors
Measurement of the X-ray Fields
Warning measured field and collimator:
Making a Calibration Curve for Film
Rescale, Step Strip, or Dosimeter
Warning
on quality control plan failure:
A
failed plan might still be good.
Any
measurement includes a measurement error.
Systematic
Procedures for Comparing Plans
Possible
Failure of This Checking System
Warning, program only tests dosimetry, not field
placement:
Number of fractions/normalization text box
Warning, number fractions/normalization text box:
Warning, input field parameters:
Warning, understand what is checked and what is
not:
Introduction
This manual gives specific details on the operation of the Dosimetry Check program. Dosimetry Check sits on top of System 2100, a general purpose radiological display system. Refer to the System 2100 manual concerning the layout of the main window, image display, printing, contouring tools, and image fusion. Refer to the Exit Transit Dose Option manual for specific details on transit dosimetry on conventional linacs. Refer to the utility manuals on the Math Resolutions website www.MathResolutions.com/mancont.htm for other functions provided, such as utility programs to import radiation fields measured with the EPID (electronic portal imaging device). The software does not measure the radiation fields. Third party and external means must be used for that function. This software will read the measured field files exported by other means.
This program provides a feedback mechanism for checking the dosimetry of x-ray radiation fields that are to be applied or are applied to patients. This is accomplished by measuring each radiation field that is to be applied and then recomputing the dose distribution to the patient using the measured fields as input and the definition of each beam. This technique does not include electron therapy. The program provides a feedback loop where the dose is reconstructed from measurement of the delivered treatment plan.
The purpose is to provide a final sanity check for the correctness of
the delivered treatment plan.
The accuracy of the dose reconstruction is limited by the accuracy of the dose algorithm and the accuracy of measurement with the detectors. The user is advised to gain experience in the use of this method and the results obtained. Definitive criteria for plan delivery acceptance or rejection are difficult to define precisely. The transit dose reconstruction accuracy is further limited by patient positioning, changes in the patient anatomy, and limitations of the dose reconstruction algorithm. Experience will be needed to evaluate how this procedure should fit in with the institutions quality control policy.
Warning on intended use:
This system is not intended to be used as a radiation therapy treatment
planning system, but rather as a system for providing a redundant dose
calculation using the feedback mechanism of basing the calculation on measured
radiation fields.
Indications for Use
Dosimetry Check is a standalone software product intended to be used by an
experienced radiological physicist for quality control purposes only.
Dosimetry Check quality control software uses the x-ray radiation
fields that are measured with media such as x-ray film, electronic portal
imaging devices (EPID), diode or ion chamber arrays, or in the case of TomoTherapy, a fan line detector array, and provides a
theoretical calculation. Dosimetry Check computes the
dose and dose distribution using the patient specific CT or other image set or
alternately a phantom that is likewise scanned, to calculate the reconstructed
dose that is then compared to the plan dose. The results reported can include
the computed percent difference at specific points as compared to the patient
specific radiation treatment plan.
Dosimetry Check does not provide any conclusions regarding the
comparisons and does not provide any criteria to be used for interpreting the
results. The experienced radiological physicist can reevaluate his patient
specific radiation treatment plan in accordance with his clinical judgment.
This product is not a treatment
planning system and is not to be used as one.
This product only checks the applied dose based on the measurement of
each x-ray field applied to the patient and provided in an exported file, and a
theoretical calculation. The product can only be used with photons (high
energy x-rays) and cannot be used with electron or proton therapy . This product does not provide any quality
assurance that the fields are in fact correctly applied to and correctly
aligned with the patient anatomy as planned. In addition, the product may be
used to display the above dose on other fused image sets which could provide
additional supportive quality information to the user regarding the correctness
of treatment.
Disclaimers
This product is intended to be installed, used and operated
only in accordance with the information within this manual and related manuals,
and System 2100 manual for the purpose for which it was designed. Nothing stated in this manual reduces user’s
professional responsibilities for sound judgment and best practice.
Users shall only install, use and operate the equipment in
such ways that do not conflict with applicable laws or regulations which have
the force of law. Use of the product for purposes other than those intended and
expressly stated by the manufacturer, as well as incorrect use or operation,
may relieve the manufacturer or his agent from all or some of the
responsibility for resultant non-compliance, damage or injury.
Math
Resolutions, LLC assumes no liability for use of this document if any
unauthorized changes to the content or format have been made. Every care has
been taken to ensure the accuracy of the information in this document. However,
Math Resolutions, LLC assumes no responsibility or liability for errors,
inaccuracies, or omissions that may appear in this document. Math Resolutions,
LLC reserves the right to change the product without further notice to improve
reliability, function or design. This
manual is provided without warranty of any kind, implied or expressed,
including, but not limited to, the implied warranties of merchantability and
fitness for a particular purpose.
Assumptions
The user must be aware of what is not checked. The patient is assumed to be in the correction position for treatment and that the radiation fields are being applied at the correct locations on the patient relative to the patient’s anatomy. The model of the patient from the snap shot of the planning CT scans used here is assumed to represent the patient.
For conventional linacs, it is
assumed that the linac is properly calibrated and
will deliver the dose for a specified monitor unit as defined by the user’s
definition of a monitor unit. It is
assumed that the correct energy was used for each treatement
beam.
Users
This manual is written for trained radiation therapy
physicist users of the Dosimetry Check product. Before attempting to work with this
software product, read, understand, note and strictly observe all Warning
notices, Cautions and Safety markings in this manual and messages presented to
the user by the software.
Before attempting to work with this software product, make
sure that this manual, related manuals and the System 2100 Manual and any
Release Notes delivered with the software media pack have been thoroughly read
and fully understood, paying particular attention to all:
- Warnings
- Cautions
- Notes
- Important
Notices
- User Notices
Training
Users of this product shall have received
adequate training on its safe and effective use before attempting to work with
it. Training requirements may vary from
country to country. The user shall make
sure that training is received in accordance with local laws or regulations
that have the force of law. Information
on training is available from Math Resolutions, LLC, or the distributor.
List of Current Distributors
Please see the website
http://www.mathresolutions.com/ListOfDistributors.htm
Location of Documentation
All applicable manuals are available on the Math Resolutions, LLC web site at the following link:
http://mathresolutions.com/mancont.htm
These manuals may be downloaded and printed out if desired.
Additional information can be found at the link: http://www.mathresolutions.com/rtqasys.htm
Hardware and Operating System Requirements
1. Hardware
For three dimensional surface shaded room view displays, an Open GL capable graphics card is required with 24 true color and a depth buffer. For added stereoscoptic three dimensional displays, an Nvidia Quadro fx card that supports stereo is needed with a single monitor capable of 120 Herz refresh rate, or the Planar Mirror System with two monitors. The program needs the same amount of memory and computation speed as a typical treatment planning system would need. For best operation, we suggest at least 2 gigabytes of memory. For faster computation, a GPU card may be used.
2. Operating System
The program will run on personal computers under the Linux or Windows operating system. The program has been tested under Microsoft Windows XP, Windows Vista, and Windows 7, and under Linux: Ubuntu 14.04. After installation, an install test is provided on the Math Resolutions website, www.MathResolutions.com, for the user or installer to follow for testing for the correct operation of the program on that particular computed and selected operating system. However, Math Resolutions, LLC, has tested the Dosmetry Check software on the operating systems identified above, if you use other operating systems that have not been tested by Math Resolutions, LLC, it is the user’s responsibility to validate the use of the alternate operating system with Dosimetry Check for your intended environment.
3. Third Party Software
The program is an X/Open Motif program using the specifications of the X window system version 11, OSF/Motif version 1.2 for the user interface, and Open GL release 1 for graphics. X, known as X11, originally developed at MIT Boston Mass. in 1987, is currently managed by the X Org Foundation (www.x.org). OSF/Motif is currently maintained by the X Org Foundation. To run on Microsoft Windows, the X server, Motif, and Open GL are required and are supplied by the software products Exceed, Exceed 3D, and the Motif dll out of Exceed XDK, from Open Text Inc., Waterloo Ontario Canada. Under the Linux operating system, X and Motif are native to Linux, and Open GL is readily available.
Installation Instructions
Installation instructions are provided on the Math Resolutions, LLC, website www.MathResolutions.com. The installer software is password protected. A license key is further needed from Math Resolutions to run the software. Contact support@MathResolutions.com for additional information.
Technical Description
Technical information specific to the use of Dosimetry Check is provided in this manual. Additional technical information regarding Dosimetry Check is available on the Math Resolutions, LLC website: www.mathresolutions.com
Security
The Dosimetry Check executable is under a license control system that is part of the System2100 library. A system identification number is developed for each computer the software is installed on by considering various aspects of the hardware and operating system. An encrypted license key is provided by Math Resolutions to allow the program to run, specific to the system identification number. The system identification number encrypted in the license key must match the system identification number generated by the program, for the program to run. Access to the computer and directories where data are stored and used by the Dosimetry Check program is the responsibility of the user.
IEC 60601-1 Medical electrical equipment
Part
1: General requirements for basic safety and essential performance
IEC 60601-1 is not applicable to System 2100, or Dosimetry Check since these products are software.
Start Up, Shut Down: Dosimetry Check Tasks
The program may be invoked by running the DosimetryCheckTasks program shown below from the desktop icon, from the start menu, or from a command prompt window:
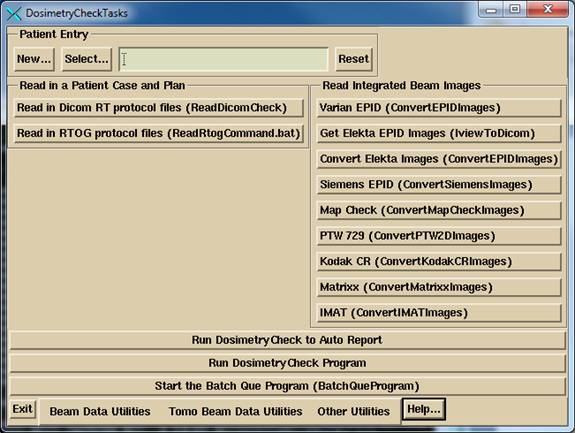
DosimetryCheckTasks will run other executables that make up the product.
The user must either recreate the plan to be checked or download it from the planning system, to include the CT scan set for the plan. The importing of the plan can be in either the Dicom RT or RTOG protocol, the RTOG protocol being replaced by Dicom RT. A process is run to import the plan, selected above.
If using an integrating device to measure the radiation fields, the data for the fields must be imported, normalized, and possibly processed to convert dose back to in air fluence. Separate programs are provided for reading in the integrated beam fields from various devices and may be selected from the above program. The fields are normalized to the center of a 10x10 cm field size for known monitor units in order to be able to compute the absolute dose. For an EPID and most devices, there is a necessary deconvolution to convert the integrated image back to in air fluence. The result of the process is written to files in the patient directory. Dosimetry Check will automatically pick up those files and match them to the respective beams if the beam names are embedded in the file names of the fluence files produced by this process.
This application rests on top of System 2100, a General Purpose Radiological Display System. Functions are here added to System 2100 under the program name of DosimetryCheck. For all functions regarding to image display, contouring, and image fusion, refer to the manual for System 2100.
Run the Dosimetry Check execitible by selecting “Run Dosimetry Check program.” When run from DosimetryCheckTasks, standard out is piped to a text log file in the home directory. Additional information is written to standard out during program execution.
Note there are two buttons to use to invoke the Dosimetry Check program. The first: “Run Dosimetry Check to Auto Report”, will attempt to automatically transverse the user interface to the auto report popup with as few mouse clicks as possible. If the patient has not been selected in DosimetryCheckTasks, the select patient popup will appear. If there is more than one plan for the patient, then the select plan popup will appear. Some checking is done as to whether all the components are there to proceed to the auto report. However, the user is responsible for being sure that fluence files have been properly generated for each beam, and that things like an external contour exist. If any attention to such details is needed, the user can simply dismiss the auto report popup and return to it later.
The “Run Dosimetry Check program” runs DosimetryCheck without any assumptions about the tasks to be performed.
The Dosimetry Check executable (any of the executables) may also be run directly from the command prompt window from the directory that it is installed in, by default c:\mathresolutions, unless installed elsewhere. Standard out will be written to the command prompt window unless you add the argument –s, which will redirect it to a log file.
To exit, hit the exit button on the left on the main tool bar. You must take this normal exit for the program to remove a lock file on the patient’s data directory. The lock file prevents concurrently running Dosimetry Check executables from accessing the same patient records.
Batch Que
A batch que is provided for computing jobs off line one at a time. At presently only the auto report function can be executed in the batch que. All jobs placed in the batch que directory will be run, the oldest job first. The directory is defined by the file BatchQue.loc in the program resources directory. A sample file is shown below:
/*
file format version: */ 1
//
Location of the batch que. Log files will be in
//
a subfolder log.d, and purged periodically.
<*c:/mathresolutions/batchque.d*>
//
purge log files older than number of days
14
The directory must
be created when the above file is created, the program will not create the
directory. The program will create the log.d sub-directory.
A log file for each job run will be left in the log directory. The run files in the batch directory will be
deleted after being run.
The user must start
the batch que program. The program will exit when all the jobs in
the directory have been run or attempted to run. Consequently the batch que
program is NOT started when you submit a job.
You must hit the "Start the Batch Que
Program" button to start the que running. When the last job is finished (the batch
directory is empty), the batch que will stop running
and will not run again until you start it again. To see if it is running, use the Windows Task
Manager and look for BatchQueProgram or the linux ps -e command.
But hitting the
start batch que program button again will have no
affect if it is already running as a lock file prevents a second instance. The batch que
program creates a lock file, "BatchLockRunning.txt" when it is
running in the log.d sub-directory of the batch que directory. Remove
that file if the batch que program is not running and
the file was left for some reason, such as shutting down the computer before
the program could complete and remove the lock file.
The batch que directory location is defined by the file BatchQue.loc in
the program resources directory, which in turn is defined by the file rlresources.dir.loc in the current directory.
The batch que program will run the oldest job first. A log file for
each run is created in the sub-directory log.d. If a job terminates because of an error, the
log file will be popped up for display.
The auto report function will popup the
resulting report file.
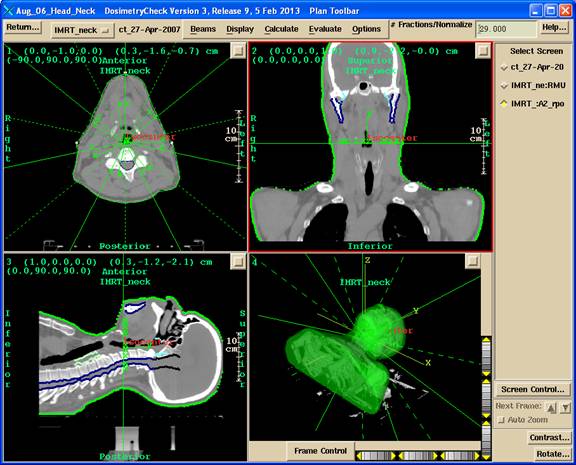
Dosimetry Check main window
An example of the main application window is shown below with the Plan Toolbar active. The currently selected patient’s name is shown on the left of the title bar on the main window, “Aug_06_Head_Neck”, in the example below. Next on the title bar follows the name of the application, then the version of the application including the assigned date of the release, followed by the name of the current toolbar that is displayed.
Toolbar Organization and Layout
Functions are organized into toolbars. The current toolbar name is shown on the title bar of the main application window. Each toolbar will comprise of pull down menus, push buttons, and other controls that may fit the area provided, for the user to invoke particular functions or to push another toolbar. Most specific functions use a popup dialog if the user interface cannot fit on the toolbar area. See the user’s manual for the specific controls on a toolbar. The drawing chart below is for the purpose of showing the main layout of the program’s toolbars.
The Dosimetry Check main module pushes the System 2100 main toolbar. There is a socket on the System 2100 main toolbar for adding the additional functionality of Dosimetry Check under the Plans pull down on the main toolbar.
The toolbar organizational diagram for Dosimetry Check follows below:
Broad Considerations in the Use of this Program
Inherent in any activity carried out by human beings in particular is the possibility of making errors. Radiation therapy presents unique problems in this regard to the application of ionizing radiation to patients. This radiation cannot be seen, heard, smelled, felt, or tasted, as the five senses do not record its presence. By contrast, a nurse who administers a drug can visually read the label from the bottle from which the drug is taken. The amount of drug that is measured out can be visually seen at the time it is administered to the patient.
Radiation on the other hand must be measured at some other time by a physicist with complex equipment and complex calibration processes. The plan of radiation is often computed on a computer where all aspects of the treatment delivery system must be modeled mathematically by the planning software. This modeling may include the insertion of objects into the beam such as wedges and shielding blocks. Intensity modulation may be designed by the treatment planning system and accomplished by a compensator manufactured for the purpose or by the treatment machine during treatment with moving multi-leaf collimators. This lengthy and complex process has multiple opportunities for errors to be committed by persons and machines.
Radiation therapy, like other medical specialties that actively act upon the patient, has zero tolerance for error. It is generally not acceptable to injure, kill, or paralyze a patient. Yet injuries, death, and paralysis can result if mistakes are made in the delivery of the treatment. Quality control measures must be instituted in any treatment center to assure proper treatment of patients as planned. The standard procedures for quality control (see references 1, 2, 3, and 4 below) generally call for the checking of each component of the treatment planning process. It is assumed, and hoped, that when all the components are correct that the end result is correct. Yet without a feedback mechanism for the entire treatment planning and delivery process, failure to detect a problem with any component or underlying concept will most likely go unnoticed. A recent example of such a system failure would be the lose of the Mars lander caused by failure to convert English units to metric units in some component of the system. No one noticed this mistake until they flew the rocket. The use of this program will allow for “flying” the plan before treating the patient.
General Quality Control Principles
General principles have been discovered in the engineering and manufacturing fields to assure quality. They include having and following documented procedures that include redundancy and feedback mechanisms. The firing of the rocket above provided the ultimate feedback as to whether the satellite would hit the target. Medical practitioners need to be cognitive of quality control methods that are employed in other industries. In the airplane industry there is a principle that the failure of a single component should not bring down the airplane. Redundancy is employed to reduce failures.
Let us examine this concept for a moment. If the failure rate of a component is 0.01 or 1 percent, and the failure rate of a redundant component is also 0.01, then the failure rate of the two components employed together so that both must fail before the system can fail is the product of the individual components, or 0.01 x 0.01 = 0.0001 or 0.01 percent, a hundredfold improvement in reliability. Therefore if a component cannot be made better, simply add redundancy.
Feedback mechanisms are also powerful tools for achieving reliable systems. Consider the float in the flush toilet. The level of water shuts off the incoming flow by lifting the float. If a simple timer were used instead and if the water pressure were to be higher on some particular day the reservoir tank might overflow before the timer shuts off the incoming water. The overflow tube in the reservoir tank also provides redundant protection against such a failure. Consequently I have yet to experience the failure of the reservoir tank overflowing in my life time to date.
Human Fallibility
Human beings perform the task of treatment planning. They must operate complex programs on computers and may also have to use calculators to compute or check the results. Human beings are fallible. No person can perform even a routine procedure repetitively without eventually making a mistake. For the past two years I have been giving fluid subcutaneously to our cat twice a week. During the two years I have stuck myself twice with the needle. My failure rate with the needle is 2 out of 208 or about 1 percent. It seems unlikely that any individual can go to work everyday over a 40 or so year career and operate computers and calculators and never make a mistake. It seems unlikely that every patient can be treated without a failure if there is no quality control process.
Typical Possible Errors
Treatment aids such as blocks or compensators may have to be made. A milling machine might make a compensator for example. Things can go wrong in the manufacturing process. The tools might not be calibrated correctly. The physicist might make an error measuring the attenuation factor. The compensator might be mounted backwards or switched with the wrong field or patient. The wrong file might be down loaded to a multi-leaf collimator system for field shaping or intensity modulation. There was an incident where a compensator was made for a lung field. The central axis went through lung but the monitor units were not corrected for lung transmission. Evidently no one noticed that the result would be the raising of doses to structures around the perimeter of the lung, such as the cord, to what the lung would get without a transmission correction, rather then the intended lowering of the dose to the lung to correspond to the dose outside the lung. This can result in the cord getting 10 to 15 percent higher dose than anticipated. I have heard of another incident where a physicist assumed the wedge factor was not accounted for in an external beam program when in fact it was, and so ended up applying the wedge factor twice.
Undoubtedly anyone who works in radiation therapy has been involved in or heard about some kind of mistake. Because of the nature of mistakes and the possible consequences to the patient, not to mention lawsuits, mistakes are probably not publicized and we may not be aware of the full extent of this problem in radiation therapy. Our concern here is to develop a procedure that will minimize the chance of any mistake not being caught before treatment.
Feedback
There remains very little immediate feedback in radiation therapy that the treatment is delivered as planned. The only feedback mechanisms commonly employed to verify the dose consist of making a surface measurement on the patient’s skin. This surface measurement can be related to a predicted dose value. However, the measurement at one or a few points does not demonstrate how the effects of all the treatment beams are adding up nor show the dose to the target volume or critical structures. Errors can still exist at other positions within the radiation field that will not be detected by a single point measurement, such as performing a point measurement on the central ray but the wedge is reversed in position. Making measurements inside the patient is generally limited to a few points if there is a cavity available and is an invasive procedure.
This product provides a feedback loop for the dose and should prove to be a powerful tool for assuring the correct treatment of patients. By calculating the dose to the patient based upon the measured fields, any mistake in the treatment plan, monitor unit calculation, or devices placed within the beam should be evident if substantial. By substantial we would hope to flag any error in dose greater than five percent. This also means that if a wedge were applied backwards, or the wrong wedge used, or some error made in intensity modulation such as downloading the wrong file to the accelerator, that the resultant dose to the patient would be evident from examining the dose distribution computed from the measured fields applied to the patient.
Advantage of This Method
An advantage of this approach is that the dose will be presented against the same anatomy that the plan was done on. The review of the dose would not be abstract as compared to, say, measuring the dose in a cylindrical phantom for which the plan has been recomputed, not that such an approach doesn’t also have its merits. A further advantage here is that the confirming dose can be computed for any desired plane throughout the patient or shown in 3d perspective room views, and is not limited to the planes measured in a phantom. By downloading the dose distribution from the planning system, a direct comparison can be made to the planned dose.
Limitations
Warning on limitations:
At the same time one must bear in mind that only the dosimetry is being checked.
Nothing is done in this process to check that the fields are in the
right place on the patient. Further, we
are also assuming that the treatments will be given with the same parameters
that the field measurements were made with, i.e. that a mistake is not made
after this dosimetry check is completed. Nor is the correct energy selection being
directly checked.
A careful review and evaluation should be done in implementing procedures so that it is understood and documented what is checked and what is not. Nonetheless, this verification of the dose distribution based on measurement eliminates many possible sources of error by providing a much needed feedback loop.
Possible False Positives: Common Errors
A possible source of failure to flag an incorrect treatment would be the occurrence of the same error in the planning and treatment process and this checking system. Care must be taken that the same mistake cannot be made twice or that complimentary errors are not made. For example, suppose a wedge or compensator is inserted in a reversed position from that intended. If the measured field used as input to this system were to be then incorrectly reversed as well as to make the device to appear to be in the correct position, the error in the device position would not be detected. If the treatment machine calibration were incorrectly specified to both the planning system and this checking system, an actual error would go undetected. Errors with the orientation of the measured field can be avoided by having a procedure with a positive lock between the measured field and the collimator. Other common errors would normally be found during routine acceptance testing of treatment planning systems and quality control of the measured beam data.
However, it is desirable to reduce as much as possible any overlapping dependency between the checking system, the treatment planning system, and treatment machine. The use of generic beam data as provided here and or the separation of the beam data used by this system from the treatment planning system will allow for independence between those two systems.
References
1. Physical Aspects of Quality Assurance in Radiation Therapy, Report Number 13, 0-88318-457-5, 1984 Radiation Therapy Committee Task Group #24, with contribution from Task Group #22, Medical Physics Publishing, 4513 Vernon Blvd., Madison, WI 53705-4964.
2. “Medical Accelerator Safety Considerations: Report of AAPM Radiation Therapy Committee Task Group No. 35, James A. Purdy, et. al., Medical Physics Vol. 4, No. 4, July/August 1993, pages 1261-1275.
3. “Comprehensive QA for Radiation Oncology: Report of AAPM Radiation Therapy Committee Task Group 40”, Gerald J. Kutcher, et. al., Medical Physics Vol. 21, No. 4, April 1994, pages 581-618.
4. “American Association of Physicist in Medicine Radiation Therapy Committee Task Group 53: Quality Assurance for Clinical Radiotherapy Treatment Planning”, Benedick Fraass, et. al., Medical Physics Vol. 25, No. 10, Oct. 1998, pages 1773-1829.
Theory of Operation
See the link at the
website
http://www.mathresolutions.com/howdcworks.htm
Measurement of the X-ray Fields
As a general rule, we believe that the persons who treat the patient should also make the exposures for the measurement of the x-ray fields. The reason is for increased assurance that the field exposure will be made identical to that used in the treatment, i.e., that the same devices will be used in the beam in the same positions. Below we discuss the possibility of making such a measurement during treatment if suitable technology is available.
|
Geometry for making a measured picture of the x-ray field. |

There are many technologies available for measuring the radiation field. X-ray film is tedious and many departments are getting rid of their x-ray processors.
EPID
Electronic portal imaging devices (EPID) and ion chamber or diode arrays are suitable replacement devices. Using these devices is covered in separate documents on the Math Resolutions website at the link: www.mathresolutions.com/mancont.htm
X-ray film
Kodak EC film in ready pack, known as EDR2 (
Measured Field Orientation
It will be important that there be no confusion as to the orientation of the imaging device relative to the collimator. An electronic imaging device that is mounted to the collimator or gantry would completely eliminate any possible orientation errors with distinction made as whether or not the imaging devices rotates with the collimator.
With film in ready pack, one can pin prick the film using a pattern that clearly marks the positive X and Y axis, such as two marks just outside the field to mark +X and one to mark +Y, with a second mark to mark the other end of the X or Y axis. Leave at least a 1 cm margin between the marks and the field image.
The imaging surface must be perpendicular to the central ray. Closer distances than 100 cm may be desirable to fit a large field within the film size available. This software can correct for a changed distance of measurement by applying the inverse square law to calibrations made at a different distance.
The location of the central ray must be known. The image of the field edges can also serve to locate the central ray with the location tool provided in Field Dose below. However, an aperture block would obscure the field edges.
Warning measured field and collimator:
There should be a positive locking system between the measured field
and the collimator, so that the location of the central ray is known, and so
that there is no confusion as to the rotation of the measured field relative to
the collimator.
An electron shield will have to be above the imaging surface to provide just sufficient material to shield contamination electrons from fogging the film. Using water density materials will cause a small problem in that scatter produced in the bolus will round off the edges of the measured radiation field. We have noted that this will cause higher isodose levels, such as the 95% level, to contract somewhat.
With x-ray film, we have gotten best results using 3mm of copper for the bolus material to shield out contamination electrons. We have not seen any degradation of the measured field edge with 3mm of copper. At 6x one can use 1 mm copper.
We do not want a phantom under the imaging surface because the measured field is to approximate an in air measurement. A phantom under the measured surface would contribute full back scatter and we are assuming that there is no back scatter in the measured field. Otherwise a deconvolution process is needed.
It is assumed that a dry run will be made without the patient. However, making a measurement of the field during treatment is not precluded if the technology exist to do that, that is, if there is a suitable device that can also be treated through. However, in that case, careful consideration needs to be given to the total attenuation the imaging device presents between the source of x-rays and the patient and the effect this might have on one treatment. If the monitor units were increased accordingly, care must be taken that the monitor units are readjusted when the imaging system is not in the beam for the rest of the radiation course.
Relative Monitor Units
The imaging system must not only record the variation of the x-ray intensity over the area of the beam, but must accurately measure the applied relative monitor units. This can be accomplished with film by running a calibration curve to convert film response to relative monitor units at the same time. Using a step wedge this can be accomplished with the single exposure of an extra film. Another variation would be to put a parallel plate ion chamber or diode above or below the imaging surface. It will have to be possible to determine the point of measurement if different from the central axis, and the chamber and leads must not introduce large artifacts onto the rest of the image of the field. Please review the below Field Dose section for a definition of relative monitor units.
Making a Calibration Curve for Film
We would recommend that you simply place the film on the treatment couch at 100 cm and cover it by the dmax thickness using a solid water slab. Use a 10x10 cm field size (assuming you have normalized your scatter collimator factor to a 10x10, otherwise correct the monitor units you use). We also recommend that you use at least 10 steps in the calibration curve from the minimum exposure to the maximum density that can be digitized by the film scanner. For example, for therapy verification film you might consider running the curve up to a maximum of 60 monitor units and shoot all the treatment fields with 50 monitor units (you can probably go higher if your film scanner can handle the darker densities).
If you expose the same film multiple times, you must consider the leakage from the accelerator. If you fit six 10x10 field exposures on a single 14x17 inch film, each field will receive the leakage from five other exposures. We would suggest that you cut each film into three strips 14 by 5.7 inches. Place each strip in an empty paper ready pack, fold the open edge over and fix with a paper clip. The 14 inch length is long enough to run through the film processor. And you can make two 10x10 cm field exposures on each strip. But, the other part of the film still must be covered by bolus to protect the film from exposure to secondary electrons. If the leakage is more than 0.5%, we would recommend you use more film with only one exposure per strip (you can also tape a leader onto smaller pieces of film for running through the film processor). The calibration curve is simply monitor units versus the measured value at the center of each 10x10 cm field. An unexposed area would serve for 0 monitor units.
Rescale, Step Strip, or Dosimeter
Using multiple exposures every time the verification system is used to create a calibration curve will be time consuming. You can either make only one curve and rescale the curve for each use, rely on a dosimeter measurement to renormalize the treatment field films, or calibrate a step wedge to generate a calibration curve for each use of the system. The issue here is that there will be large variations in film response due to variations in the film processor and possibly from one film batch to another and we need to correct for that variation.
Rescale the Calibration Curve
To correct for changes in film processing, it may only be necessary to rescale the calibration curve. When making film images of each field for a patient case, expose one extra calibration film, typically 10x10 cm, to a known monitor unit. Use the existing calibration curve to determine the relative monitor units for the calibration film. Type in the monitor units used on the provided popup tool (see Field Dose in next chapter) to rescale the calibration curve. The rescaled curve is saved and then used separately and instead of the original curve.
Dosimeter
If using a dosimeter, you could use a parallel plate ion chamber imbedded in plastic and place it either immediately above or below the film. The software has options for you to simply type in the reading, the temperature and pressure if an ion chamber, and the distance. You need to calibrate the dosimeter in the same geometry used by making an exposure with the 10x10 cm field size for known monitor units. The film calibration curve will correct for the dose on a relative basis, with the dosimeter supplying an absolute value.
Making a Step Strip
The sensitometer meters used in radiology are too fast for our films and also have too much variation between exposures. Stated stability is typically +-0.02 log exposure, which means about +- 5% in exposure. You can instead make a step strip out of cerrobend or lead. The linear attenuation factor will very with energy. Using a value between 4 and 18 MV x-rays (-0.420/mm) we have computed suggested thicknesses for a step wedge made out of cerrobend:
|
approximate % transmission |
Thickness cm |
|
0 |
extend thickest part beyond field edge. |
|
4.3 |
7.5 |
|
10 |
5.5 |
|
20 |
3.8 |
|
30 |
2.9 |
|
40 |
2.2 |
|
50 |
1.6 |
|
60 |
1.2 |
|
70 |
0.85 |
|
80 |
0.53 |
|
90 |
0.25 |
|
100.0 |
0.0 |
A band saw can be used to cut out each step. You may want to cut the sides on diverging rays.
To calibrate the step wedge, you must still run a calibration curve. Then place the step wedge on top of the film. Decide on the field size and orientation that will always be used (still assuming the film is at 100 cm), i.e. mark where the central axis is to go on top of the step wedge. Expose to slightly less than the largest monitor units you used when you ran the calibration curve. Digitize this film with the calibration curve. Next use the software to create a step wedge file. The calibration curve will be used to assign an equivalent monitor unit to each step.
Then when treatment films are exposed, make a film using the step wedge for the same distance, orientation, field size, and monitor units used to create the step wedge file. The software will then associate the measured value for each step with the above equivalent monitor units to generate a calibration curve that can be applied to the treatment field films.
Digitizing Film
The field image must be converted to digital form. Some consideration must be made to the dynamic range of the film scanner device, if digitizing film, as to the maximum density that can be measured. You must use less monitor units so as not to exceed the dynamic range of the film scanner. The program has an option to allow you to scale the measured values up by the ratio of monitor units used to expose the film to that for the treatment field if the monitor unit prescription exceeds the dynamic range, which will be the case if using therapy verification film.
The zero crossing of the response of the film digitizer must also be considered. Some signal should be seen for an unexposed area of the film, otherwise it may be that low doses are being truncated to zero.
Another consideration is the number of bits that can be digitized. Eight bits per pixel will only permit a number from 0 to 255 to represent the range of monitor units. Since field prescriptions can top off around 250 to 300 mu, we would barely have the resolution of 1 mu. With the necessary dynamic overrange needed to insure that the range is not exceeded, the resultant resolution will probably be even less. If the number of bits limits accuracy, consider adding a dosimeter reading to the field measurement as mentioned above.
Even if the device has 12 or 16 bit analogue to digital converters, the image file format must also be considered. The Tiff format for example only supports 8 bits per color, so the image pixel data would normally have to be truncated to 8 bits. Usually the same number is stored for each of red, green, and blue or a single byte (8 bits) is used for gray scale. However, in one case using software with the 12 bit Vidar film scanner, we noted that 12 bits were in fact being written to the Tiff file with the 12 bits distributed over the red, green, and blue color bytes. This is not part of the Tiff standard as gray scale can only go to 8 bits, but we have nonetheless modified our Tiff reader to decode a 12 bit number from the red, green, and blue fields. We are not able to read non-standard 16 bit Tiff pixels. We will attempt to deal with this issue as the need arises if other encoding schemes are encountered.
The PNG format can accommodate a 16 bit gray scale pixel, has provision for specifying a pixel size, and so is to be preferred over using TIFF.
The Dicom standard permits a data size of 12 or 16 bits per pixel and so is preferred for this application.
If the accuracy in terms of the absolute dose in relative monitor units cannot be achieved with only digitized film images, then a parallel plate ion chamber or a small diode (or mosfet) should be used either in the bolus stack immediately above the measuring surface, or might be placed immediately below. The point measurement is used to renormalize the dose array. The calibration curve is still used before the final renormalization. We would like to have the relative monitor units measured to within 1 or 2 percent to have confidence in the result. This is achievable with film relying upon a step wedge or a point measurement.
Pixel Size
Another issue with the Tiff and PNG formats is that the pixel size is an optional parameter, not a required one (actually the image size is specified from which the pixel size can be computed). Yet we need the pixel size of the digitized image. If the pixel size is not in the file, a message will be popped up and the user will have to determine the pixel size. This can be accomplished with the provided tool that locates the field image in beam’s eye coordinates.
Dose Recomputation Procedure
The CT scans, beam positions, outlined regions of interest, and a 3d dose matrix can be downloaded in Dicom RT or RTOG format. If the skin boundary is included in the download, it is only necessary to select that volume as being the skin boundary. The Dicom RT protocol has a mechanism for specifying that. A pixel value to density conversion still must be done with this software, as the conversion curve is not part of the Dicom RT or RTOG protocols.
If the plan cannot be downloaded, the user must read into this software the CT scan set used for the treatment plan. A skin boundary must be generated and CT pixel number to density specified. Then the user must locate the isocenter of each beam. The plan will have to be referred to with at least two orthogonal (perpendicular) views of the image data to locate isocenter. A transverse scan will show where isocenter is in the plane of the scan, but a sagittal or coronal reconstruction may be needed to show where isocenter is along the axis parallel to the long axis of the body perpendicular to the transverse plane. The beam location is easily adjusted with this software along three axes. Subsequent beams will start with the isocenter of the prior beam. The user must also select the correct energy. The user must set the gantry, collimator, and couch angles for each beam.
Lastly, in either case, each beam must be associated with the respective measured field. This can happen automatically or the user can select the measured fields for each beam. Selecting two or more fields will result in them being added together. When this process is completed the dose distribution can be computed.
Comparison of Results
Dosimetry Check does not provide any conclusions regarding the
comparisons and does not provide any criteria to be used for interpreting the
results. The experienced radiological physicist
can reevaluate his patient specific radiation treatment plan in accordance with
his clinical judgment.
See the Plan section of the Dosimtry
Check manual on how to make dose comparisons using the comparison tools
provided to compare the dose reconstructed by Dosimetry
Check for the pre-treatment or exit-transit to the planning system dose.
For the check of the dosimetry to be effective, the result of the dose computation must be compared to the treatment plan. The user should plot the same planes presented in the plan for comparison. The hot spot (maximum dose) should also be noted as this may indicate a conditioned that has gone unnoticed. The normalization point (usually isocenter) should be computed for comparison with the plan. The normalization point and hot spot can serve for an objective comparison. The dose distribution comparison will be more subjective in nature, but one can look at the target volume coverage and dose to critical structures.
Warning on quality control plan failure:
Treatment of the patient must NOT continue until any large difference
in dose greater than five percent to significant volumes is understood and
corrected. The treatment plan must not
be changed based solely upon the result of this check, rather the cause of any
such difference must be resolved and understood and a corrected treatment plan
produced, the Dosimetry Check result corrected, or
some other means used to verify the correctness of the plan.
Be aware that one user reported an instance where the planning system incorrectly computed the dose to the patient (due to an error in the body contour), but correctly computed the dose to a phantom. As a result, Dosimetry Check correctly flagged an error but a measurement in a phantom did not flag the error to the patient and so incorrectly confirmed the planning system.
A failed plan might still be good.
The possibility certainly exists that a difference with the plan beyond some predefined tolerance, such as a gamma criteria below, might not necessarily mean a failed plan. If the dose to the target and critical structures are still acceptable, the plan might still be acceptable. One can evaluated the Dosimetry Check dose with the same criteria used to approve the plan.
Any measurement includes a measurement error.
Be aware that Dosimetry Check results are based on the accuracy by which the radiation fields can be measured.
Gamma Method
The gamma analysis method provides a means to compare two dose distributions taking into account both dose at a point and distance to where the dose is the same. See the reference in Medical Physics by Daniel Low, et. al., Vol 25(5) May 1998, pp. 656-661, "A technique for the quantitative evaluation of dose distributions." The reason here is that in a low gradient area, the isodose curves from two distributions for the same dose can be far apart whereas the difference in dose is actually small. And in a high gradient area, the there can be a large change in dose at a point but only a very short distance to where the dose is the same.
Comparison Tools
Several comparison tools are available for the case when the plan is downloaded from the treatment planning system and includes a 3d dose matrix, and are described in a separate section. The tools include, besides the above gamma method, generating a difference dose volume histogram, showing the computed and downloaded dose on the same images, showing a plot of the dose difference on an image, and showing a 3d perspective room view of the dose and dose difference. Using this feature, one could also use this program to show the downloaded dose distribution on other fused image sets.
Algorithmic Differences
One can expect small differences in dose due to differences in the algorithm between this system and the planning system. Some knowledge of those differences may be needed. The pencil beam algorithm if used here is not going to do well in internal interface areas and differences can be expected if compared to an algorithm that does account for interface effects such as Monte Carlo or the fully implemented point dose convolution/superposition collapsed cone algorithm which is also available here. We can also expect differences at field and block edges in penumbra regions. Within the beam no closer than one cm to an edge, we should expect any two systems to agree within at least five percent, hopefully three percent. However, one should not be surprised at dose differences greater than five percent in regions of electronic disequilibrium which includes beam edges.
Another potential source of small differences might be the skin boundary. Here shape interpolation is performed (unless turned off) between contours that are further than several millimeters apart.
Systematic Procedures for Comparing Plans
The user should develop a systematic procedure for comparing the doses from the two systems, noting the dose that covers the target area, the dose to critical structures, and the maximum hot spot doses. Significant differences should be understood and resolved. Comparing the dose at a central point provides an objective measure, as well as the difference dose volume histogram and gamma volume histogram.
Possible Failure of This Checking System
Warning, program only tests dosimetry, not field placement:
This system only tests the dosimetry, not the
actual application of the fields to the patient.
The actual treatment to the patient will depend upon the proper placement of the fields on the patient and that the fields are not changed or different for actual treatment.
With the dosimetry check performed here, there are two modes of failure, false positive and false negative. False negative is showing an error when none exist and a false positive shows no error when one in fact exist.
False Negative
False negative is showing an error when none exist. A negative result alerts the user and investigative action should be taken to resolve the problem. Disagreement with the plan dose can occur for many reasons that do not involve a treatment error. The chain for measuring and processing the radiation fields must be correct at all steps for Dosimetry Check to correctly reproduce the planning system dose. An error at any step will sabotage the end result.
Warning, False Negative:
Under no circumstances should the treatment by changed without other justification to force agreement with Dosimetry Check. Dosimetry Check is not a planning system.
False Positive
A false positive shows no error when one in fact exist. A false positive should be less likely but consideration should be given to the possibilities. A false positive would result if the same error applied to both the checking system and the original planning system. A common error might result from using the same beam data. However, one would expect normal quality control procedures for commissioning the planning system to screen out any such error in the beam data. Further, there is the possibility for using generic data provided with the checking system that would make the checking system more independent of the planning system. But even the generic data may require some editing by the physicist to properly define how the treatment machine is calibrated. For example, is the distance to the calibration point 100 cm + dmax or just 100 cm? Is the depth dmax or 10 cm? If the wrong monitor unit definition is given to both the planning system and Dosimetry Check, such an error cannot be detected.
Number of fractions/normalization text box
The number of fractions/normalization text box is provided to provide a factor to multiply the Dosimetry Check dose. This is needed in the case that the user has downloaded the dose from the planning system for more than one fraction. Dosimetry Check only computes the dose for a single fraction if the beams are measured for a single fraction. So if the planning system was for 20 fractions, the Dosimetry Check dose must be multiplied by 20 to directly compare the dose from the two systems. If the user does not want to view the dose for multiple fractions, than only down load the dose for one fraction. There might be some other unforeseen reason to multiply the Dosmetry Dose by some factor and so modify the number in this text box.
Warning, number fractions/normalization text box:
Do not use this field to produce an agreement where none exist.
Another source of a false positive error would be if the fields are set up correctly for the dosimetry check but incorrectly for the actual treatment. But this last consideration applies equally to the daily treatment of the patient in that there must be consistency and some control for guaranteeing consistency. Checking the placement of the fields on the patient is beyond the scope of Dosimetry Check.
Warning, input field parameters:
The dosimetry check program relies upon the user properly defining the isocenter and angles for each field, and for properly specifying the energy of each beam. The measured field must be correctly associated with each beam.
Special attention needs to be paid to the actual field measurement and the means to determine the orientation of the measured field relative to the collimator. The measurement device, be it film or otherwise, must be consistently placed in the same orientation relative to the collimator. If the measurement device attaches to the collimator this is assured. If not a procedure must be established, such as always putting the collimator in its unrotated position and always having the film or measurement device in the same position on the treatment couch. Further, some markers may be needed so that the beam’s eye view x and y axes are clearly discernible as well as which side of the film the x-ray source was on. With film in ready pack, a pin prick outside the field would serve this purpose. But be aware also that the image of any marker will also be interpreted by the checking system as a change in dose.
Warning, understand what is checked and
what is not:
The user must take care to clearly understand what part of the treatment process the dosimetry checking system is confirming and what parts of the process the system cannot provide a check.
Future enhancements of this system might include spatially calibrated images of the patient that can be compared to the rendered skin surface for verification of the patient’s position relative to isocenter. Similar measurements of the treatment machine gantry and collimator may be possible.
Fused Image Sets
Warning, Fused Image Sets:
Clearly, if the checking system signals a difference and an error in the
dose, the system cannot be used to show the dose on a fused image set.
The dose distribution transferred to the same plane in a fused image set should be the same in both identical planes. The tools provided with image fusion provide means to verify that the fused solution is correct. Only if the fusion solution is correct and the dosimetry check agrees with the plan can the dose shown on a fused image set be relied upon.