Specifying
the Primary Stacked Image Set
Image Pixel
to Density Conversion
Warning: other
image modalities:
Select CT Number to Density Curve
Default CT Number to Density Curve
Warning: curve
will not be extrapolated beyond entered values.
Fit Pixel Density Data Pairs to a Curve
Point to Point Linear Interpolation
Saving the Density Conversion Curve
External
Structures: Bolus, Couch Top
Couch and bolus modeling in earlier versions of
DosimetryCheck
Specifying the Primary Stacked Image Set
Each plan must be associated with a stacked image set. The stacked image set is chosen when the plan is created. This stacked image set is the primary image set and provides the skin boundary and pixel to density conversion. The dose may be shown on other fused image sets, but the calculation of the dose is based on the skin boundary and density defined by the primary stacked image set. Normally this is a CT data set since CT pixel numbers can be translated to density values.
Setting the Skin Boundary
Under the Contouring toolbar there is a Body Surface Contouring tool. If this tool is used to create contours, those contours will by default define the skin boundary. The skin boundary defines what is inside the patient and what is outside. If this tool is not used or is used more than once, or the resultant volume is copied, or any ambiguity exists as to what defines the skin boundary, than the user must formally select the volume that represents the skin boundary. From the main menu under Stacked Image Sets, choose Options and then choose Skin to select the skin toolbar.
|
The skin toolbar. |
The toolbar shows the name of the current stacked image set which was chosen with the prior Options toolbar and provides a pull down menu to select the volume that is to be the skin boundary volume. The current choice, if any, is shown to the right of the pull down menu. If you have not yet created a volume that represents the skin boundary you must first do so using any of the contouring tools provided under Contouring on the main tool bar.
Image Pixel to Density Conversion
There must be a means to convert the pixel values in the primary stacked image set to density in either electron density relative to water or gm/cc. This is accomplished by creating a conversion curve that is used to convert pixel value, the independent variable, to density, the dependent variable. A polynomial fit of pixel value versus density data pairs is done to generate this curve. The curves are stored and may used repeatedly by different stacked image sets.
To select or create a density conversion curve, go to the Stacked Image Sets pulldown menu on the main toolbar. Select Options and be sure to select the stacked image set. Then hit the Density button and the Density toolbar will appear.
|
The Density Toolbar. |
The name of the current stacked image set is shown to the right of the Return button on the density toolbar. Below we will describe the options on the Density toolbar.
Show Scanner
The show scanner button will display a popup with the manufacturer’s name of the imaging device, normally a CT scanner, the image modality (a two character code from the Dicom image file (0008,0060)), and the KVP if known for CT.
|
Show scanner popup |
Warning: other image modalities:
The software does not restrict from using imaging modalities other than
CT for the primary stacked image set, but conversion of pixel values to density
is generally not possible with other modalities. In those cases it is not possible to correct
the dose for inhomogeneities in tissue density.
For those cases the user must create and assign a constant curve whereby
all pixel values are mapped to water density.
Water equivalent densities can be assigned to region of interest
outlined volumes.
Select CT Number to Density Curve
The select curve button will display a list of the existing density conversion curves for the selection of one to use with the stacked image set. These curves are stored in the subdirectory DenCur.d under the directory for data specified by the file DataDir.loc in the program resources directory. The user assigns the file name when the curve is created. Once selected, the curve is permanently associated with the stacked image set. A copy of the curve is not made from the data directory and if the file is ever deleted, the association will be lost.
Default CT
After selecting a curve, the user may designate the curve as the default curve. Future new stacked image sets will default to this curve until the user chooses some other. The default curve name is stored in the file “DefaultPixeltoDensity” in the same directory DenCur.d.
Create/Edit Curve
|
Create pixel to density conversion curve popup. |
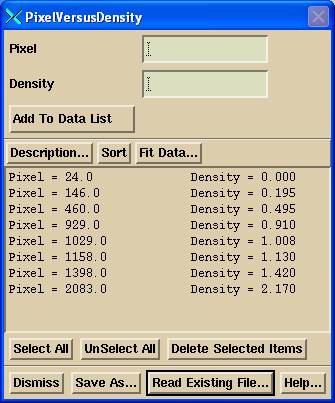
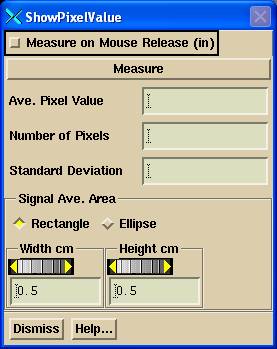
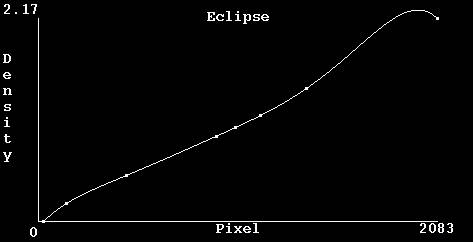
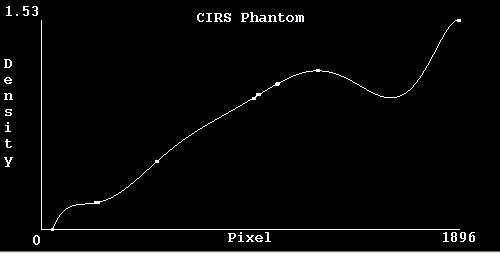
The creation of a curve consists of two functions. First a list of data pairs, pixel value and density, must be created. Second, a curve must be fitted to the data pairs. This process is managed by the create/edit curve popup tool. The show pixel value popup will also appear and may be used to measure pixel values on a calibration scan. Phantoms can be purchased that contain tissue equivalent inserts for generating this calibration curve (Gammex RMI, Middleton, WI 53562, www.gammex.com; CIRS, Norfolk VA 23513, www.cirsinc.com; and Nuclear Associates, Carle Place, NY 11514, www.nucl.com also offers the CIRS phantom).
Warning: curve will not be extrapolated beyond entered
values.
The density range should start at 0 for air, and go to the highest bone value that is obtainable. Because either a polynomial fit is used or a point to point linear interpolation, the density values will not be extrapolated beyond the range that is entered here. The highest bone value that is entered here will be the largest density possible. For pixels with higher values the largest bone value will be returned. The same is true at the other end of the curve, smaller pixel values will return the end value at the low end of the curve, which is why the curve should start at zero.
Pixel values refer to the values in the images that make up the stacked image set. Hounsfield numbers are not used here. For CT scans, a value of 1024 generally corresponds to water density or Hounsfield number of zero. A Hounsfield number of value –1000 would then correspond to a pixel value of 24. One generally sees a pixel value of zero outside of the reconstruction circle of a CT scanner.
The pixel values may be measured with the show pixel value popup, or may be typed in the text field provided. The corresponding density must be typed in.
As water is the basis for all dosimetry, the density is
specified relative to water with a value of 1.0 for water and should reflect
how a material absorbs the x-rays of a beam relative to water.
If you feel you just enter some large value beyond the range of your phantom, we recommend that you use the Point to Point Linear Interpolation method below, as adding a large value might skew the polynomial fit within the more important tissue density range.
Note that the data of an existing curve can be selected to be read back in.
Fit Pixel Density Data Pairs to a Curve
|
Fit Pixel Versus Density Popup |
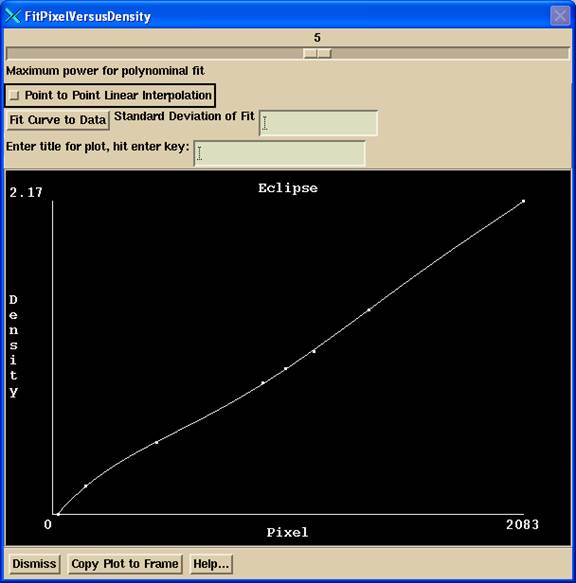
The fit pixel versus density popup provides the tool to fit the data to a polynomial or to do a linear point to point interpolation. This popup is invoked from the above tool to enter the data.
Polynomial Fit
A slider allows one to select the order of the polynomial from 0, a constant, to a limit of order 9. You must have more data pairs than the order. You should select the highest order that puts a smooth curve through the data. Try different orders and hit the Fit Curve To Data button. The curve is drawn through the plotted data pairs in the lower part of the popup tool. The standard deviation of the fit is also shown. You may notice that as you increase the order of a polynomial, the curve may begin to oscillate to pass through data points.
Examples of too high a polynomial fit order:
You will have to lower the order of fit so that does not happen. If specifying a constant curve, simply enter data pairs that all have the same density of 1.0 and select zero order, such as (0.0,1.0) followed by (4096.0,1.0). To specify a straight curve for a CT scan simulated by program CreateSquareCTScan provided for testing purposes, enter (0.0, 0.0), (1024.0, 1.0), and (4096.0, 4.0).
Point to Point Linear Interpolation
Besides a polynomial fit, you may choose to do a point to point linear interpolation, as shown below:
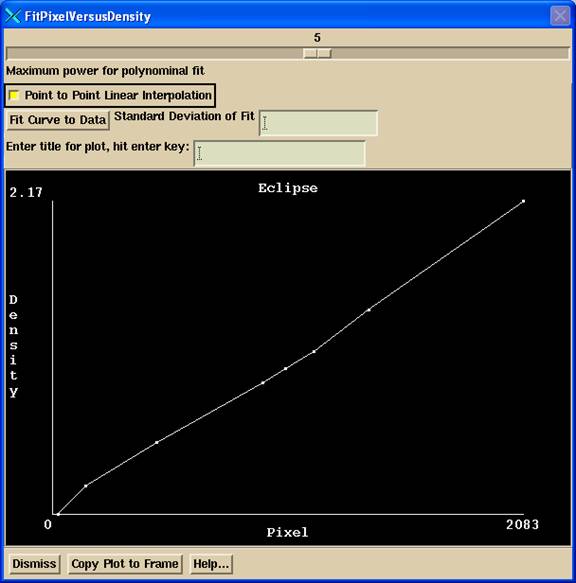
In this case, the data must be sorted in increasing order by CT pixel number, and the density value cannot be decreasing for increased CT pixel number. Use the Sort button on the above data entry tool to sort the data entered. You would not use this method if entering multiple densities for the same pixel value. You will have to average the densities elsewhere and make a single entry.
Curve Title
A title for the display may be entered in the provided text field. Be sure to hit the enter key at the end of entering in the text. The Copy Plot to Frame button may be used to display the curve and data in a frame on a regular screen.
When satisfied with the fit, hit the Dismiss button.
Saving the Density Conversion Curve
Hit Save As button to save the curve. You will be prompted to enter a file name for the curve. Enter a name that will be descriptive of the curve that you will recognize in the future. Once you have saved the curve, you must select the curve for the stacked image set using the Select button on the Density toolbar. If you do not save the curve, it will not be used.
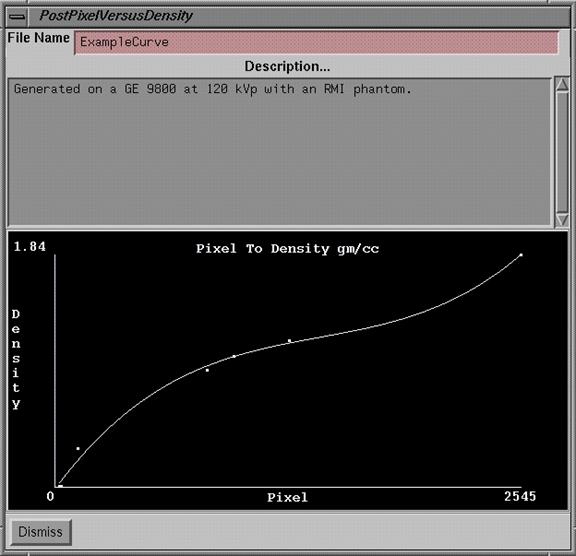
An example file is shown below:
/* File format version */
2
// Title of the curve:
<*CIRS Phantom*>
// Description of the
curve:
<*CIRS Phantom,
/* Point to point
interpolation, 0 is off, 1 is on: */ 0
// If ON, below
polynominal fit is NOT used.
/* Polynominal power
range */ 4
// Fit parameters:
-0.02414482662
0.0005517499482
1.541587399e-006
-1.436522148e-009
3.682452427e-013
/* Fit variance = */ 0.001481
/* minimum signal = */
49.400002
/* maximum signal = */
1896.000000
/* minimum density = */
0.000000
/* maximum density = */
1.530000
/* signal label: */
<*Pixel*>
/* density label: */
<*Density*>
/* Number of data pairs:
*/ 17
// signal density
49.400002 0.000000
246.000000 0.200000
256.899994 0.200000
521.400024 0.500000
525.599976 0.500000
961.799988 0.960000
965.400024 0.960000
980.500000 0.990000
987.200012 0.990000
1067.800049 1.060000
1069.699951 1.060000
1070.199951 1.070000
1072.900024 1.070000
1252.900024 1.160000
1256.800049 1.160000
1892.099976 1.530000
1896.000000 1.530000
Show Density Conversion Curve
|
Show Pixel to Density Curve Popup |
Use the Show Curve button to display the currently used curve for the currently selected stacked image set selected under Options on the prior toolbar.
Show Density
The show density tool will allow you to determine the density value for points visible on images of the primary stacked image set. You may use the Show Pixel Value popup to measure the pixel values on images from the stacked image set. The density will be computed from the currently selected pixel to density curve for the stacked image set.
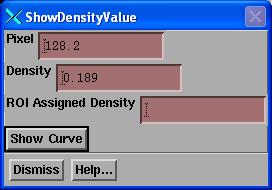 The
tools shows the pixel where you clicked the mouse. -1000 Hounsfield will have a
pixel value of 24, 0 Hounsfield will be 1024.
The density shown is that computed from the pixel value. If the point is in a region of interest
outline that has been assigned a density and that feature is turned on (see
below), then the assigned density is also shown (or average of assigned
densities).
The
tools shows the pixel where you clicked the mouse. -1000 Hounsfield will have a
pixel value of 24, 0 Hounsfield will be 1024.
The density shown is that computed from the pixel value. If the point is in a region of interest
outline that has been assigned a density and that feature is turned on (see
below), then the assigned density is also shown (or average of assigned
densities).
Set Density of ROI Structures
You can set the density of an ROI structure. That density will be used instead of computing from the CT numbers.
Note: in versions prior to 26 March 2012, only that part of the ROI structure that is inside the body outline will be used in calculation. Versions of 26 March 2012 and after, ROI areas outside of the body outline are considered.
If two or more different ROI structures (with a set density) should overlap,
the average density will be used in the overlapping areas.
Consideration should be considered if a separate ROI is to designate a hole. In that case a new ROI should be generated from the ROI with the hole ROI subtracted. If the ROI has an interior contour that is designate a hole, then “Allow Holes” must be turned on. See the instructions below for modeling a couch top for an example.
The density may be set from the Main toolbar -> Contours -> Volume pull down -> Set Density.
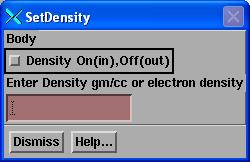 The
Density toggle button must be in and a value entered. Untoggle the density button to turn the
feature off.
The
Density toggle button must be in and a value entered. Untoggle the density button to turn the
feature off.
External Structures: Bolus, Couch Top
In any version of DosimetryCheck after 26 March 2012, an ROI volume or any part of an ROI volume that is outside of the skin-body will be considered in computing that path of a ray for computational purposes. If a density has not been assigned to the ROI volume, than the CT number to density conversion will be used. Otherwise the assigned density will be used, but with the caveat that if two or more ROI’s with an assigned density should overlap, than an average density is computed from the assigned densities. Therefore bolus can be outlined outside of the skin-body ROI volume and assigned a density. A patient supporting couch can be outlined and assigned a density. But be careful to consider whether there is an interior contour. Holes must be allowed in an ROI volume for such an interior contour for the interior to be considered to be outside of the volume, as discussed below.
Any point that is not inside an ROI volume will not be considered and a
default density of zero is assumed.
If you want structures outside of the skin-body ROI to be considered, but do not need to assign a density, then you can create an ROI that includes those areas. This can be as simple as a contour in each of the end CT slices that define the stacked image set as long as the contours define a common overlapping area when viewed perpendicular to the planes they are in. Two contours in the same ROI that overlap will create a volume between them regardless of their distance apart.
See further below for instructions with an earlier version of DosimetryCheck.
Couch Top Modeling
There might not be reason to model a couch top with a hollow interior. You might only need a single outer contour that defines the geometry of the couch top with an assigned water equivalent density. Measure the water equivalent density of the couch top and assign that density. To measure the water equivalent density of a material, find the water thickness that has the same measured attenuation as the material (the couch top in this instance). The water equivalent density is then the equivalent thickness of water divided by the thickness of the material. The result of ray tracing through a single component model will be no different than ray tracing through a two component model when there is symmetry (equal thickness ratios when traced in all directions between the components).
Hollow couch top
However, if the couch top is modeled with a hollow interior, be sure to consider the hollow components of the couch top.
Intersecting ROI volumes
Be aware that if two or more ROI volumes intersect, such as shown below:
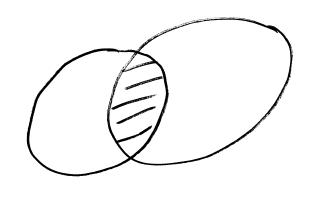 Then for any
point in the intersection (in both volumes), shown as the shaded area above, and
if both volumes are assigned a density, then the average density of all the
assigned volumes the point is in will be used.
This includes the case of one volume inside another (since the inside
volume will be the intersection of the two volumes). Only assigned densities are averaged.
Then for any
point in the intersection (in both volumes), shown as the shaded area above, and
if both volumes are assigned a density, then the average density of all the
assigned volumes the point is in will be used.
This includes the case of one volume inside another (since the inside
volume will be the intersection of the two volumes). Only assigned densities are averaged.
Separate ROI volumes
Therefore, if the hollow components are a separate ROI, then you must create a new ROI that includes the outer ROI’s but with the interior ROI’s subtracted. Only assign a density to this new ROI. If a density has been assigned and is left assigned to the original ROI, you must turn if off. Use the tool under the “Volume” pull down on the Contouring toolbar. Select “New Volume From Old”. See this feature in the System2100 manual in the “Outlining Regions of Interest” section. Otherwise where the hole should be, the assigned density of the orginal volume will still be used, and if the interior ROI was also assigned a density, the average of the two will be used in the overlapping volume.
Same ROI volume
If the holes are contours in the same ROI volume, rather than being a separate ROI volume, then first turn on to allow holes in the ROI.
Given two contours in the same ROI, one inside the other as illustrated below:
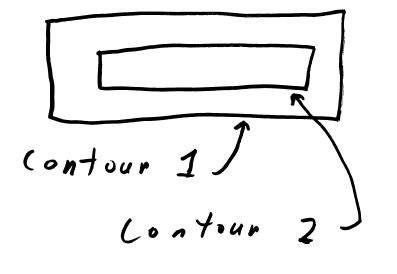
The issue is whether the inside contour is to indicate a hole in the volume or not. Is the volume that inside the outside contour as shown in shaded area below:
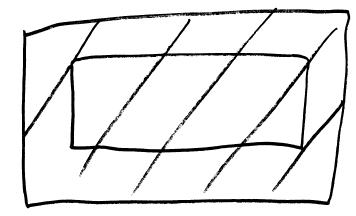
Or is it the volume that which is between the two contours as shown below:
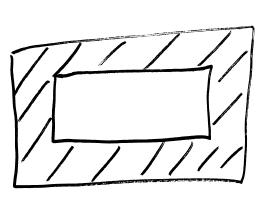
For the above latter case, the inside contour must designate a hole in the volume. With holes allowed, a point inside an odd number of contours is inside the volume, if inside an even number of contours than is outside the volume.
Hole in ROI volume
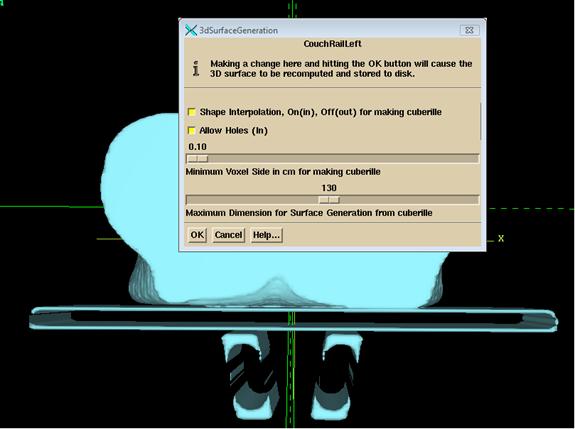
On the Contouring toolbar, select the ROI (ring_table in the example below) and then under the “Volume” pull down menu select “Voxel/Surface Generation”:
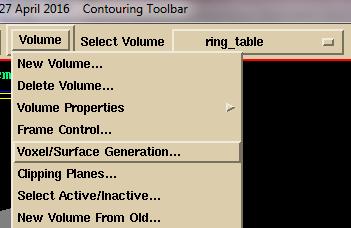
and then select “Allow Holes” (allow is in, yellow).
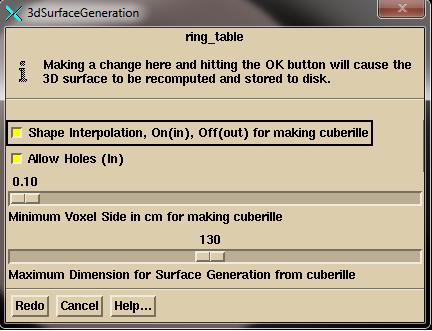
And hit the “Redo” button.
Then the interior contour will not be part of the ROI and the assigned density will not be applied.
Show Density
In all cases, use the “Show Density” tool to verify that you have it correct. The “Show Density” tool is on the stacked images set Options toolbar. From the main toolbar select “Options” under the “Stacked Image Set” pull down to get the “Stacked Image Set Options” toolbar, then select “Density” to get the Density toolbar.
If done correctly, a couch top with hollow interiors should look like the below:
Couch and bolus modeling in earlier versions of DosimetryCheck
Prior to 26 March 2012, DosimetryCheck had no provision for accounting for external structures that may be in the beam. However, you can still account for them in the following manner. Under the Volume pull down on the Contouring toolbar, select “New Volume From Old”. See this feature in the System2100 manual in the Outlining Regions of Interest section. All you have to do is select the external structure, be it bolus or a couch top, and select the current body outline structure, to form a union of the two or more structures. Then you must select this new structure as the body outline structure. You will have tricked the program into including these structures as part of the body. Any density set in any of the included structures will be used as described above. Be aware that a volume histogram of the new combined body structure will include the new volumes added. However in that case, just select the original body outline structure instead for the histogram.
For a couch top, be sure to consider the hollow components of the couch top. If the hollow components are a separate ROI, then select those ROI’s to be subtracted from the union of the external contour and the other components.