
|
www.MathResolutions.com
Software Products for the Radiological Sciences
| Search |
|
www.MathResolutions.comSoftware Products for the Radiological Sciences |
|
| Home Page | Product Review | Program Manuals | Download Programs | Purchase | Site Map |
| Dosimetry Check | MarkRT (VGRT) | RtDosePlan | System 2100 | MillComp | C++ Library |
 Below we show side by side a pre-treatment quality control
result and the exit-transit quality control result for a head and neck
case VMAT two arcs on an Elekta treatment machine. The
pre-treatment result is from integrating the arcs on the EPID
without the patient being there. The exit-transit result
are from EPID images integrated during actual patient treatment.
Below we show side by side a pre-treatment quality control
result and the exit-transit quality control result for a head and neck
case VMAT two arcs on an Elekta treatment machine. The
pre-treatment result is from integrating the arcs on the EPID
without the patient being there. The exit-transit result
are from EPID images integrated during actual patient treatment.
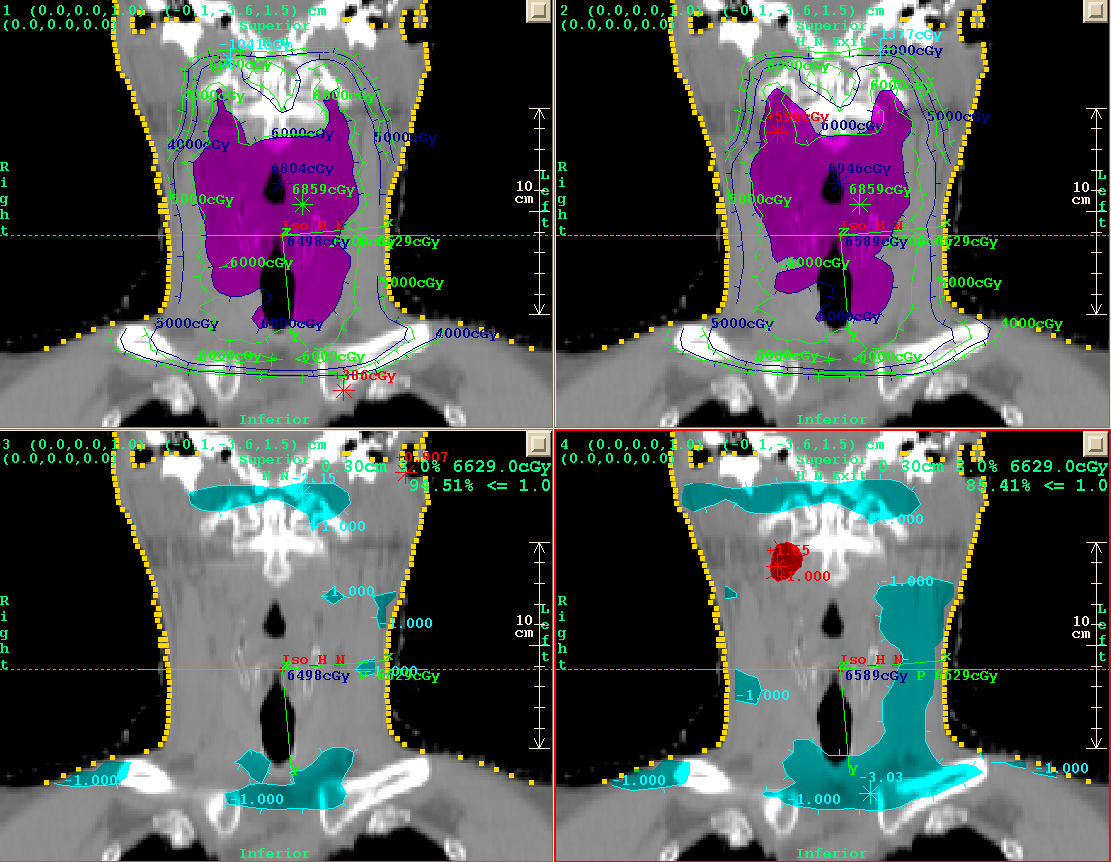
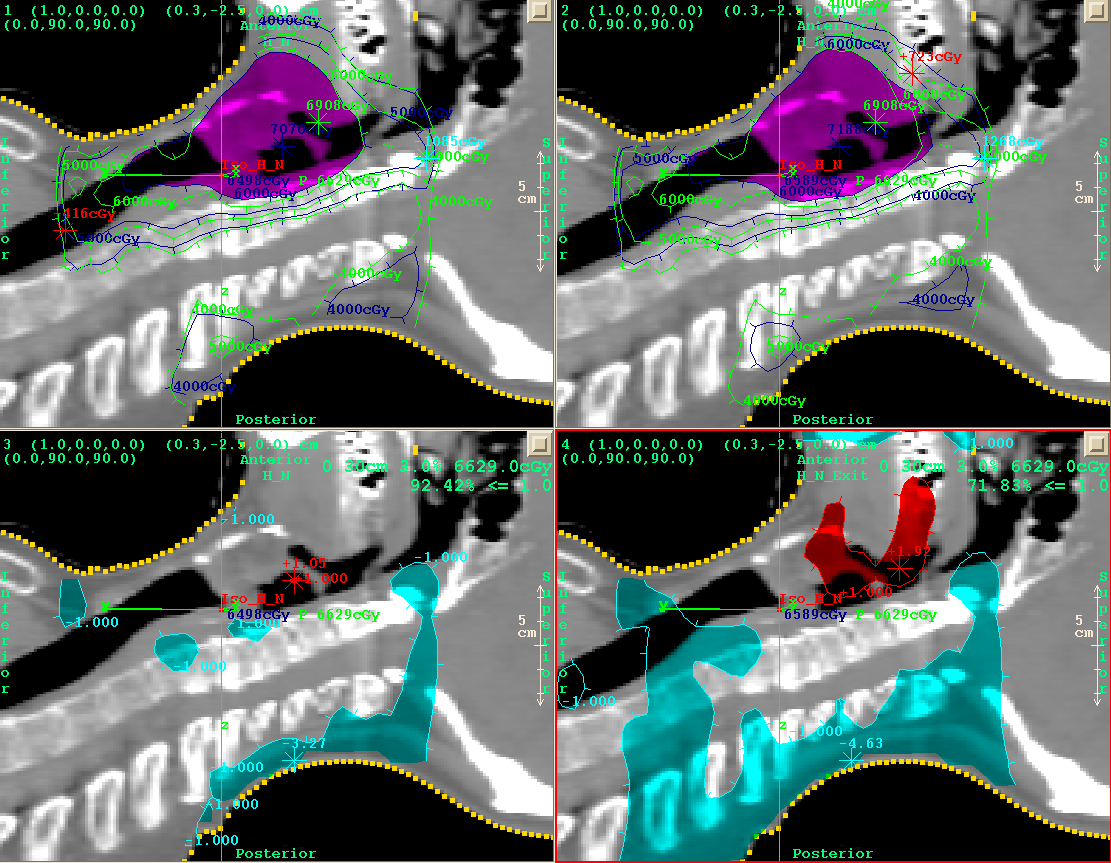
In the images below, the pre-treatment qa result is on the left,
the exit-transit result is on the right.
Below we see the transverse slice. On the left the pre-treatment
isocenter reconstructed dose was 6498 cGy for 33 fractions. While
the dose reconstruction is for only one fraction, the dose is
multiplied by how many fractions the plan download was for.
The plan dose was 6629, the reconstructed dose a -2.0% difference.
The exit-transit reconstructed dose was 6589 cGy, a -0.6% differnce.
In top row is a comparison of isododose lines. Magenta is the reconstructed dose, green is the planning system dose. The reconstructed dose of 6000 cGy is tinted magenta.
The second row is gamma analysis for 3%-3mm for a gamma value
of 1.0. Red tinted areas are where the reconstructed dose was
more than the plan dose, cyan where the dose was less.
![]()
Next we show the coronal slice.
Next we show the sagittal slice.
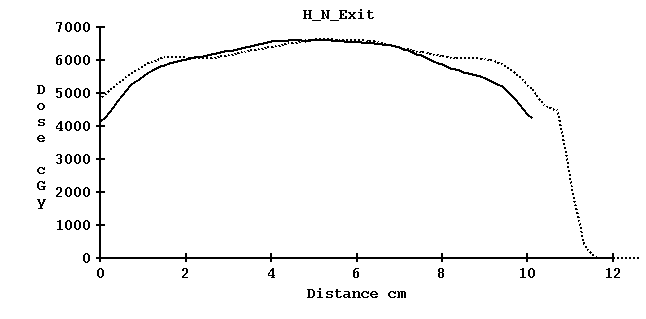
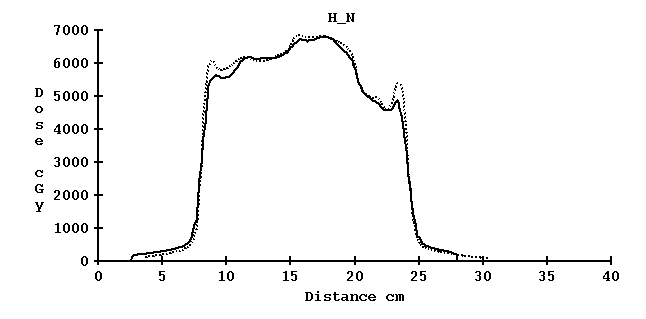
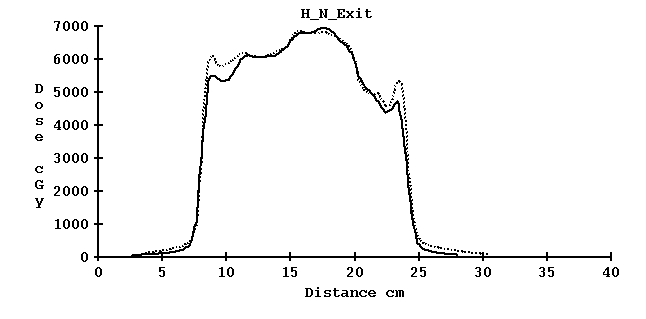
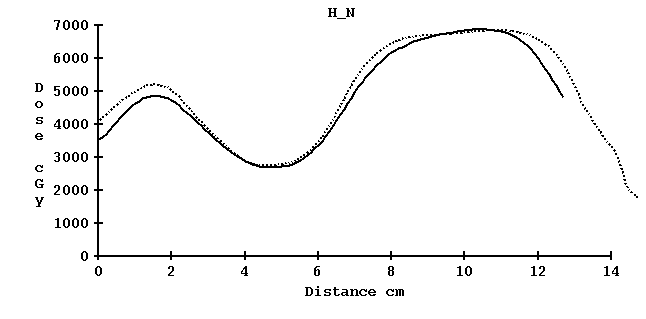
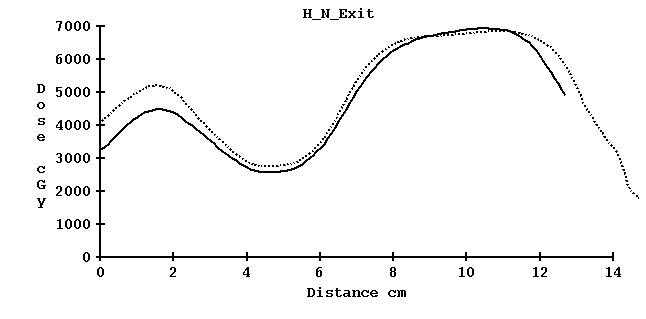
Profile comparisons.
Another way to look at the results is to compare the profile though
a point. Below we show profile comparisons along the X, Y, and
Z axes through isocenter (in the IEC coordinate system, Y is toward
the patient's head, Z is up). The dotted line is the dose from the
planning system, the solid is the reconstructed dose. Again, on
the left is the pre-treatment result, on the right is the exit-transit
dosimetry result.
Profile along the X axis. Patient right to left.
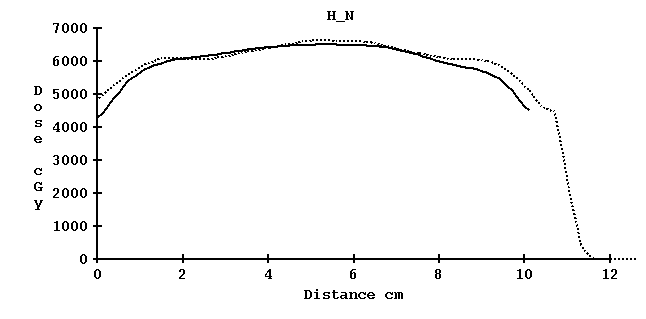
Profile along the Y axis. Patient feet to head.
Profile along the Z axis. Patient posterior to anterior.
Dose Volume Histograms.
A dose volume histogram is shown next. Dotted is from the plan,
solid is pre-reconstructed dose, dash is exit-transit reconstructed
dose.
[dotted might appear twice as the histograms are plotted from random
selection of points in the volumes, each plan considered separately.]
Gamma volume histogram.
Lastly we will look at a plot of gamma volume histogram. Here
we consider the complete body model, the external (skin) outline
region of interest (ROI). The percent of the volume that
has a gamma value less or equal to one can serve as a single
number to evaluate the plan. Gamma volume histograms may also
be shown for any selected ROI volume.
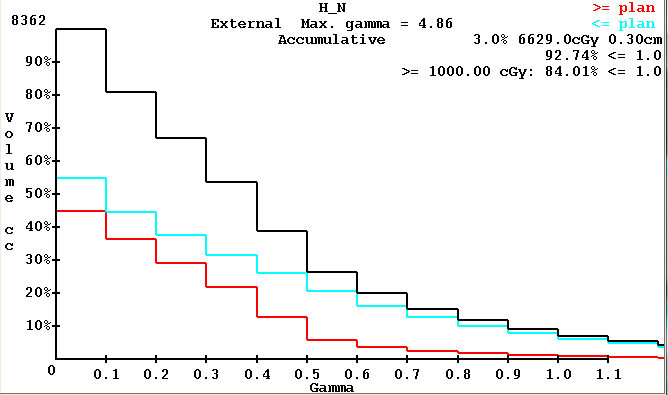
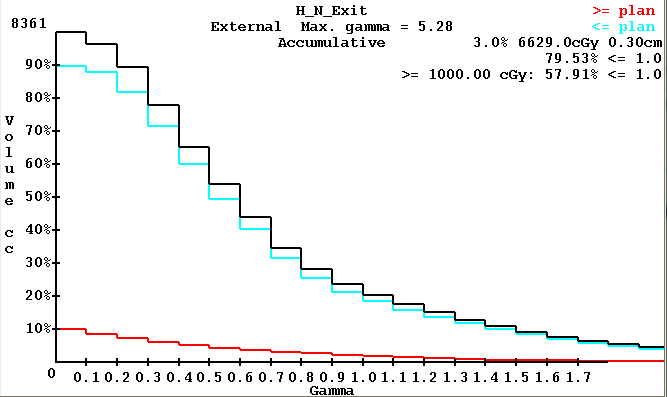
We notice from the above that there is better over all agreement
with the pre-treatment qa result than the exit-transit result.
In general, the exit-transit result will not be as accurate as
the pre-treatment result. Use the exit-transit result to establish
a base line for subsequent trials to check against for any error
that might develop during treatment.
As a final analysis, if the reconstructed dose still meets the treatment creteria, than the plan passes. This resolves the problem of the difficulty of defining pass-fail creteria.
We believe that the exit-transit dose reconstruction can serve as a further valuable tool to prevent mistakes in radiation therapy.