|
www.MathResolutions.com
Software Products for the Radiological Sciences
| Search |
|
www.MathResolutions.comSoftware Products for the Radiological Sciences |
|
| Home Page | Product Review | Program Manuals | Download Programs | Purchase | Site Map |
| Dosimetry Check | MarkRT (VGRT) | RtDosePlan | System 2100 | MillComp | C++ Library |
This is a case with three non-coplanar RapidArc arcs. You will have to transfer the plan to Aria in order for the Portal Vision system to integrate multiple images during a RapidArc rotation. Alternately you could integrate the entire arc and compare the dose computed for the composite straight down on a phantom.
Each arc is simulated with the series of stationary beams at each integrated image. So in effect a rotation is simulated with a series of fixed beams. We can then compare the dose reconstructed by DosimetryCheck to that computed by the planning system.
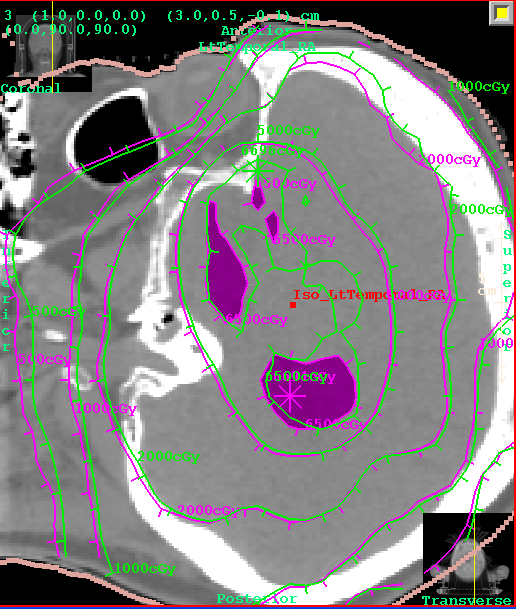
Shown below are DosimetryCheck isodose curves in magenta, compared to
the plan in green. Either the plan dose may be tinted in green,
or the DosimetryCheck dose may be tinted in magenta for a particular isodose
value, for ease of comparison. Normally one would compare a single
treatment but the total dose was downloaded for 35 fractions, so
the comparison is done for 35 fractions. The DosimetryCheck results
for a single treatment are multiplied by 35.
Shown below is the transverse plane through isocenter for doses of 6500, 5000,
2000, and 500 cGy. 6500 is tinted.
![]()
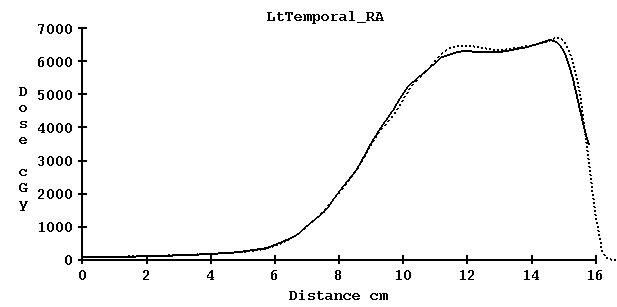
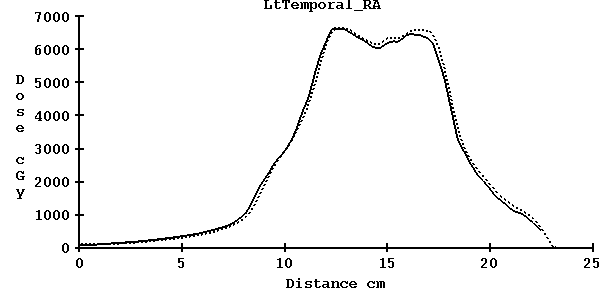
We can also compare the profile along a line. Below is the profile
along the X axis, patient right to left, through isocenter.
Solid line is the reconstructed dose, dotted is the planning system dose.
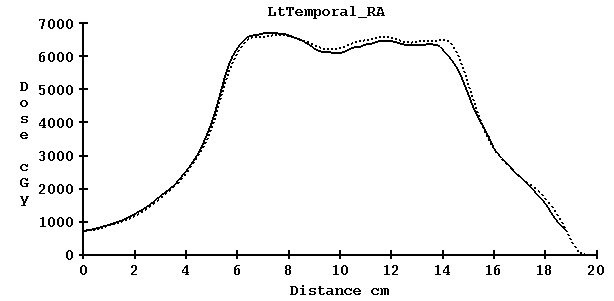
Next below is the profile along the Z axis, patient posterior to
anterior, through isocenter.
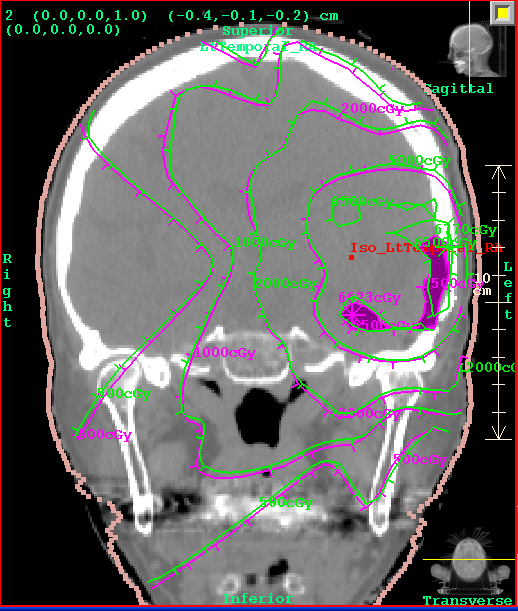
Shown below is the coronal plane throught isocenter dose comparison
for doses of 6500, 5000, 2000, 1000, and 500 cGy.
Shown below is the sagittal plane.
Next below is the profile along the Y axis, patient inferior to
superior, through isocenter.
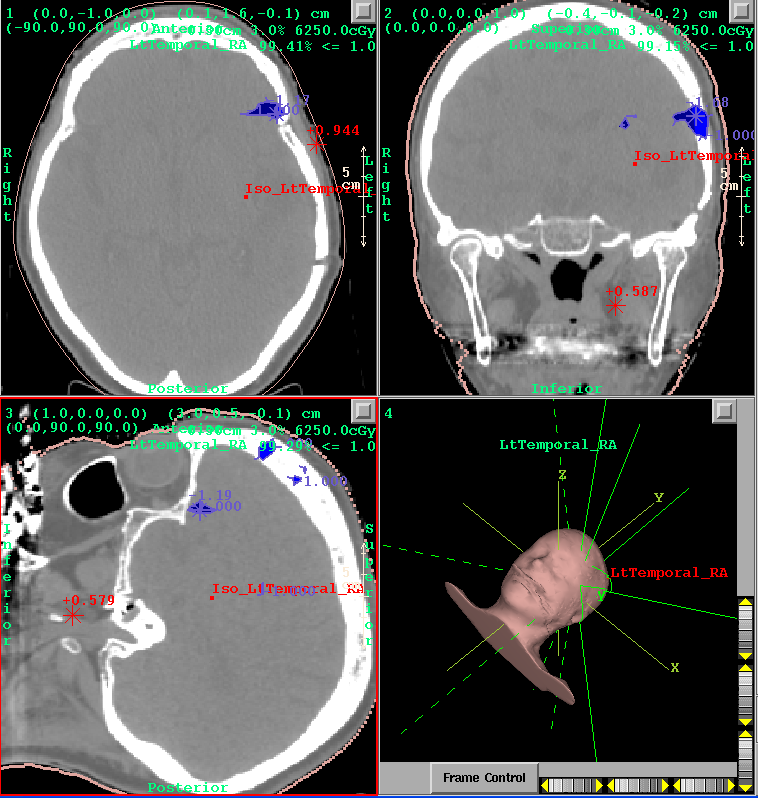
Next we consider gamma analysis. We use a criteria of 3% of 6250 cGy or 3 mm. A gamma (absolute) value of 1.0 or less means that the dose at a point either agreed to within 3% or it was less than 3 mm to a point with the same dose (searched in the 3D).
Shown below is the gamma value of 1.0 isocurves in the same transverse,
coronal, and sagittal planes. Only very small areas have a gamma
value > 1.0 in this case. Areas tinted red had a dose greater than
the planned dose, blue is less than the planned dose. Notice also
that in each plane, 99% of the plane has a gamma value <= 1.0.
Gamma hot spots are identified with the * with the gamma value for
dose > plan red, dose < plan blue.
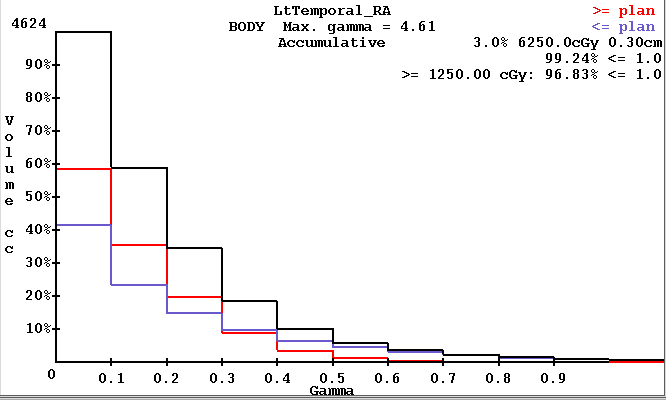
Next we may consider a gamma volume histogram. Shown is that for the
whole body where we see that 99 percent of the points in the body
have a gamma value less than 1.0, and
97% of the points with a dose greater than
1250 cGy (20% of prescription) has a gamma value less than 1.0.
This plan delivery clearly passes.
Experience is needed to establish passing criteria. The gamma
volume hisogram can be generated for any region of interest (ROI)
volume.
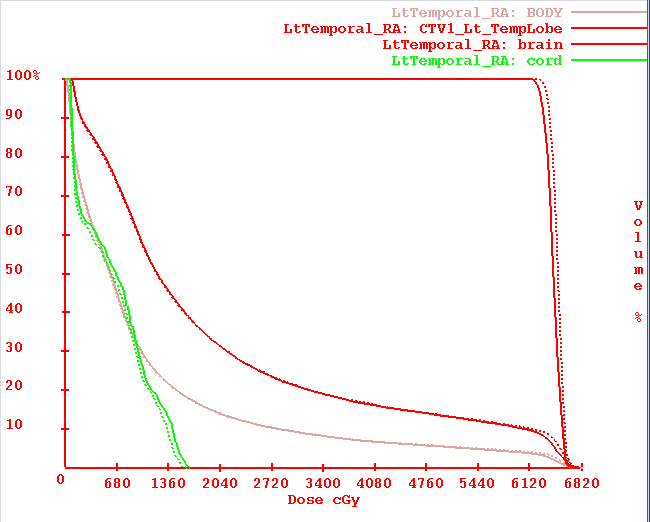
Lastly we can compare dose volume histograms between the plan and
the dose reconstructed here. Dotted is the histogram computed from
the 3D dose matrix from the planning system. Solid is from the
dose distribution reconstucted here by DosimetryCheck for some
selected ROI volumes.
We hope you enjoyed this example case of verification of treatment delivery with the Varian EPID and DosimetryCheck. This particular case exhibited very good agreement. This is not always seen as you may note in the other examples we have postd on this website.
The time and effort required is a dry run without the patient to integrate the fields and then generation of a report. You will have documented verification that the plan is being delivered. The assumptions are that (1) the beams are on the patient where they should be and (2) that the accelerator is calibrated correctly since we calibrate here in terms of monitor units and (3) that the correct energy was used during treatment.
Return to DosimetryCheck page.