
|
www.MathResolutions.com
Software Products for the Radiological Sciences
| Search |
|
www.MathResolutions.comSoftware Products for the Radiological Sciences |
|
| Home Page | Product Review | Program Manuals | Download Programs | Purchase | Site Map |
| Dosimetry Check | MarkRT (VGRT) | RtDosePlan | System 2100 | MillComp | C++ Library |
This is a case with seven IMRT fields. There were two carriage positions for each field due to the field size for a total of 14 measured integrated fields for 7 treatment beams. Program ConvertEPIDImages is run to read in all fourteen integrated files and do a deconvolution to convert to fluence (in units of RMU). A single 10x10 field was used to define the center of these fields and provide the calibration to RMU. If one does not have the Varian "exact arm" and if the beams are shot at different angles, then a separate 10x10 field will be needed at each gantry angle to define center and the calibration to RMU. This is because the R-arm EPID can move some during gantry rotation. In this example case, all the fields were shot at gantry angle zero. Shown below are the integrated fields, with the corresponding carriage shifts added together. Remember that everything effecting the intensity of the beam, such as the multi-leaf collimator, and things like the penumbra effects due to the geometry of the beam restricting devices and source sizes, comes from the measured field, not a model. The measured intensity below replaces a beam model and is the source model for calculational purposes.
Next we run program DosimetryCheck, select the patient, and select the
plan that was downloaded in Dicom RT format.
DosimetryCheck can use the file names of the integrated images
to assign the files to the beams in the plan.
We can also manually select the corresponding
file for each beam.
Shown are the final fields that define each treatment portal.
[IMRT_neck is the name of our plan. The fields are A1 to A7]
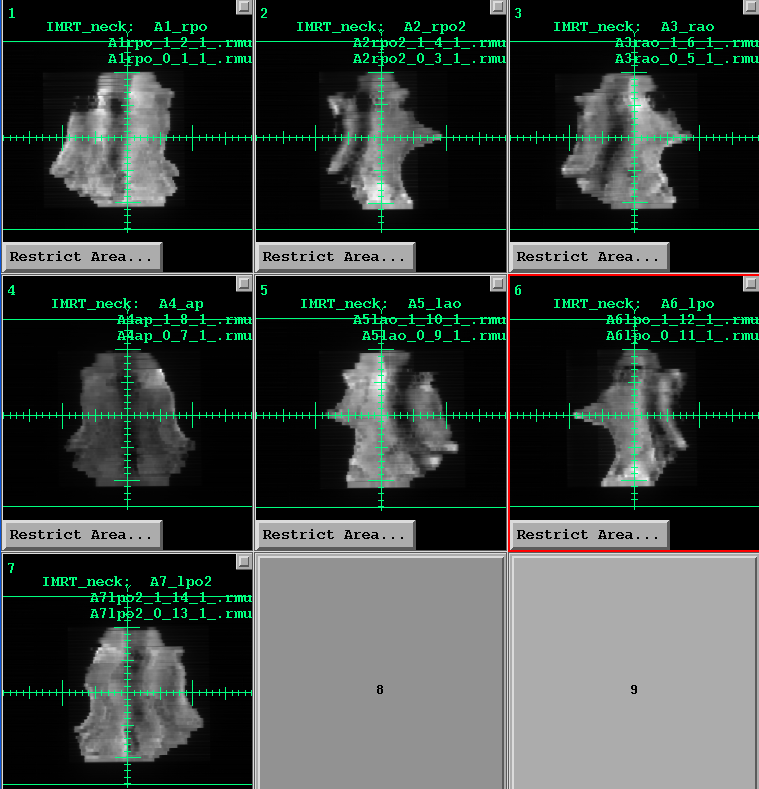
[case supplied by Art Pinkerton, North Mississippi Medical Center, Tupelo, MS]
We can compare the dose reconstructed by DosimetryCheck to that computed by the plan. Or alternately, we can compare one beam at a time in the patient (or a phantom). You can also do composite beam dosimetry with all the beams superimposed on top of each other. You only have to download the dose computed by the planning system for the same geometry.
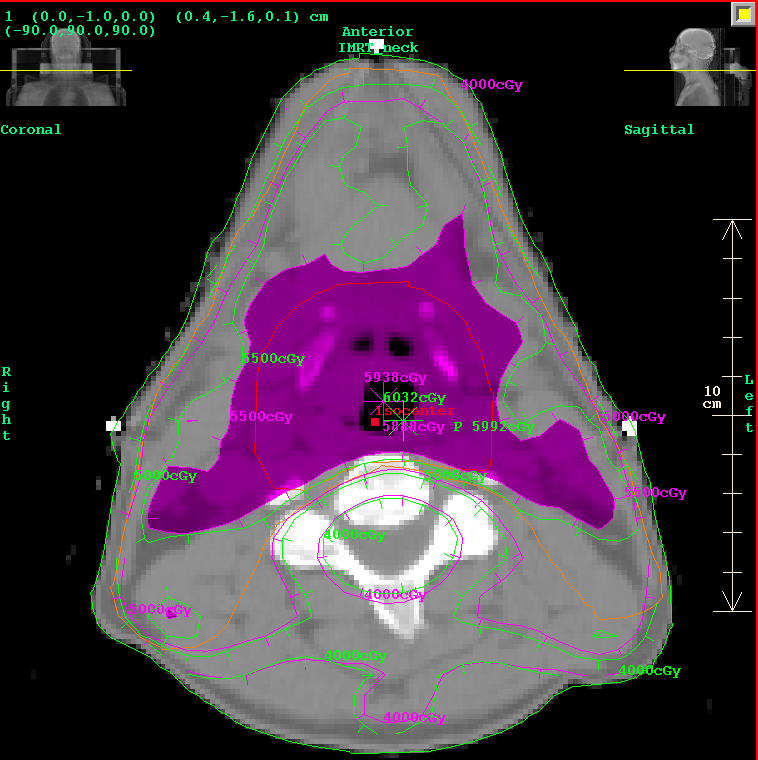
Shown below are DosimetryCheck isodose curves in magenta, compared to
the plan in green. Either the plan dose may be tinted in green,
or the DosimetryCheck dose may be tinted in magenta for a particular isodose
value, for ease of comparison. Normally one would compare a single
treatment but the total dose was downloaded for 29 fractions, so
the comparison is done for 29 fractions. The DosimetryCheck results
for a single treatment are multiplied by 29.
Shown is a transverse plane for doses of 4000, 5000, and 5500 cGy.
5500 is tinted.
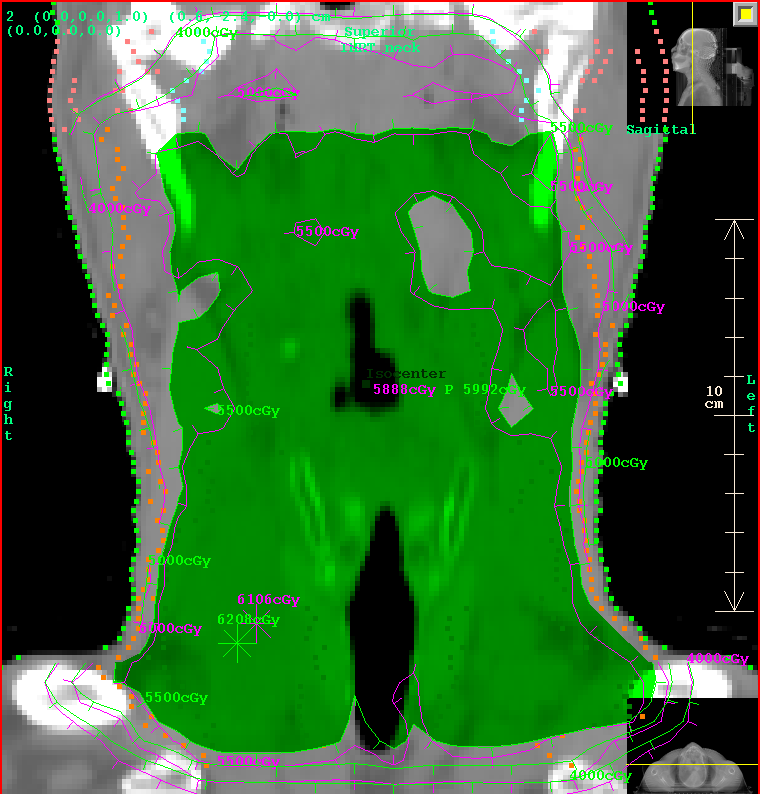
Shown below is a coronal plane.
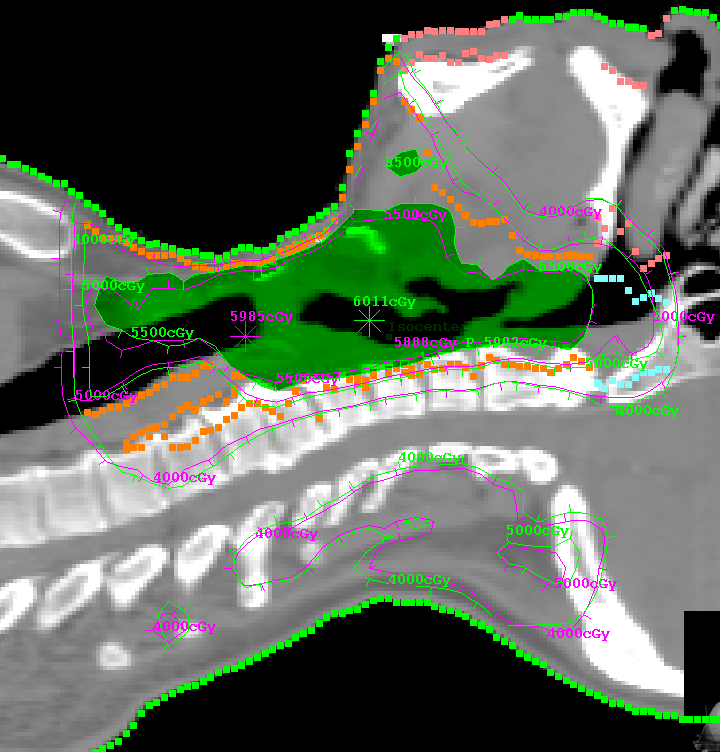
Shown below is a sagittal plane.
Next we consider gamma analysis. We use a criteria of 3% of 5800cGy
(the prescription dose of 200 x29)
or 3 mm. A gamma (absolute) value of 1.0 or less means that the dose
at a point either
agreed to within 3% or it was less than 3 mm to a point with the same dose.
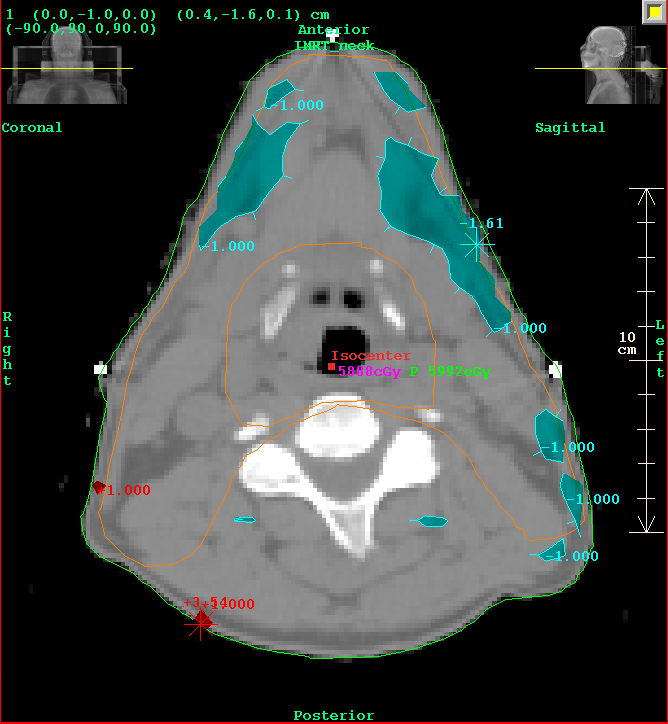
Shown is a transverse plane. Notice that the 1.0 gamma values (tinted
red if dose > plan dose, cyan if dose < plan dose) are all
outside the treatment volume in low dose areas.
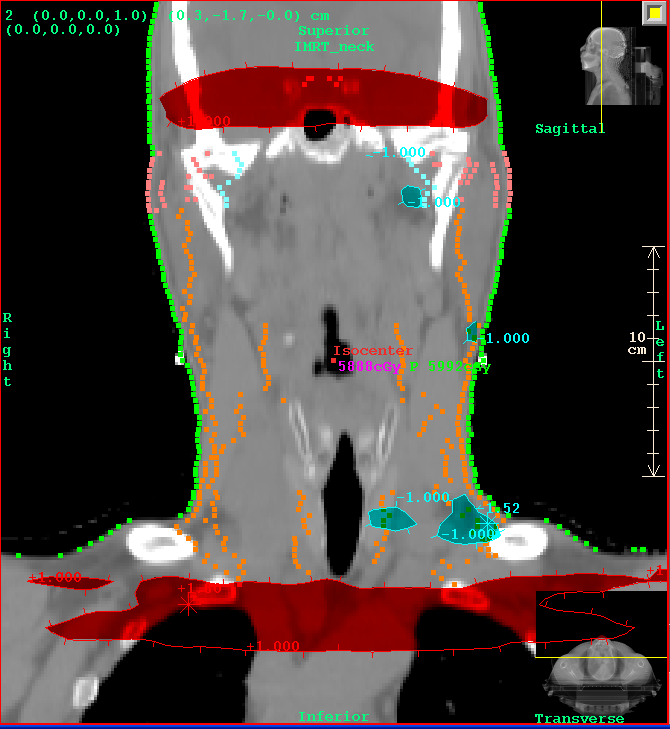
Shown is a coronal plane.
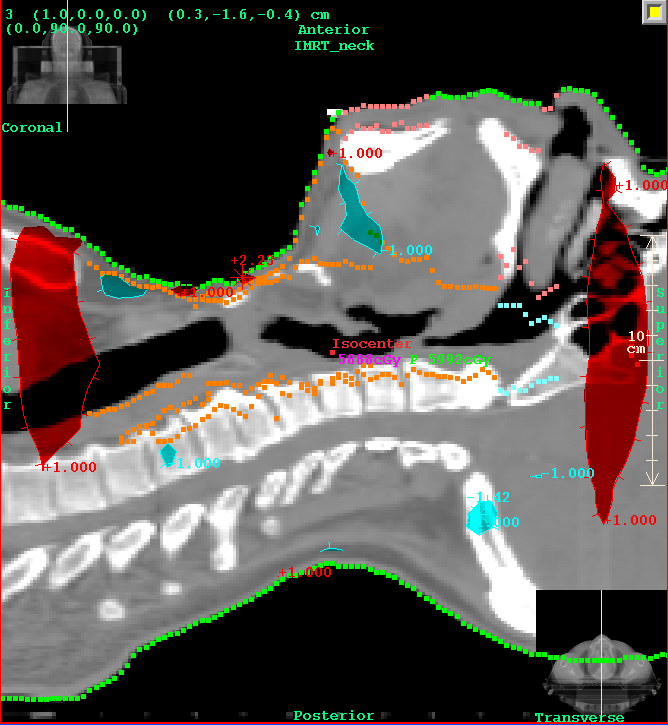
Shown is a sagittal plane.
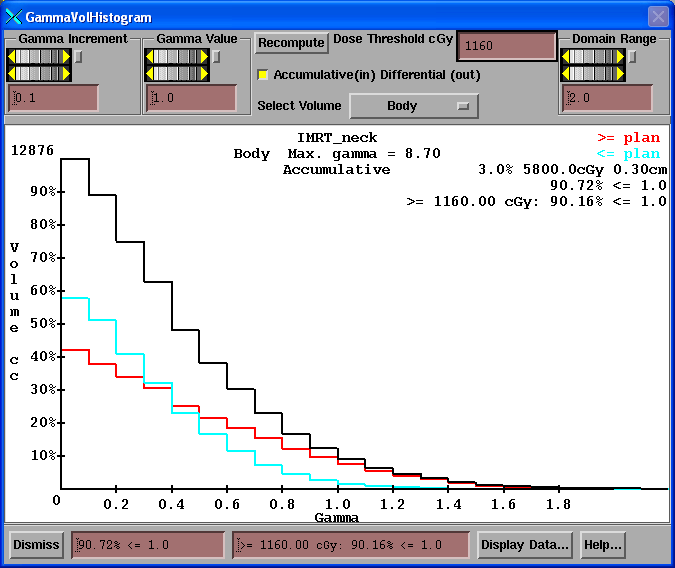
Next we may consider a gamma volume histogram. Shown is that for the
whole body where we see that 90.72 percent of the points have a gamma
value less than 1.0. And 90.16% of the points with a dose greater than
1160 cGy (20% of prescription) has a gamma value less than 1.0.
This plan delivery passes. Experience is needed to
establish passing criteria.
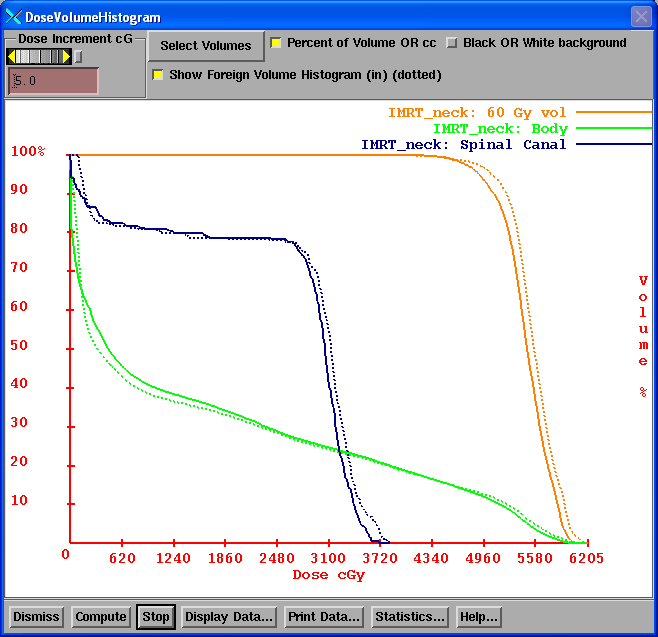
Lastly we can compare dose volume histograms between the plan and
dose reconstructed here. Dotted is the histogram computed from
the 3D dose matrix from the planning system. Solid is from the
dose distribution reconstucted here by DosimetryCheck.
We hope you enjoyed this example case of verification of treatment delivery with the Varian EPID and DosimetryCheck. The time and effort required is a dry run without the patient to integrate the fields. The program run we did here should take you less than an hour. You have documented verification that the plan is being delivered. The assumptions are that (1) the beams are on the patient where they should be and (2) that the accelerator is calibrated correctly since we calibrate here in terms of monitor units and (3) that the correct energy was used during treatment.
Return to top page.