
|
www.MathResolutions.com
Software Products for the Radiological Sciences
| Search |
|
www.MathResolutions.comSoftware Products for the Radiological Sciences |
|
| Home Page | Product Review | Program Manuals | Download Programs | Purchase | Site Map |
| Dosimetry Check | MarkRT (VGRT) | RtDosePlan | System 2100 | MillComp | C++ Library |
This is a case with a single arc done on a RandoPhantom. The Elekta IviewGT system was put into a movie loop integration mode. This mode, however, does not record the gantry angle for each portion of the arc that is integrated.
To obtain the gantry angle, a log file (a .xml file) can be generated from the accelerator control console that records dose rate versus time and gantry angle versus time.
As an alternative to generating the .xml log file, one can use an inclinometer mounted on the accelerator to measure gantry angle versus time. We can supply the inclinometer and a supporting computer program.
From that information, the xml file or the inclinometer record, the gantry angle for each arc portion is derived.
52 integrated images were captured during the VMAT arc of 360 degrees, with an integration about every 6.9 degrees
Each arc is simulated with the series of stationary beams at each integrated image. So in effect a rotation is simulated with a series of fixed beams, here each 6.9 degrees apart on average. We can then compare the dose reconstructed by DosimetryCheck to that computed by the planning system.
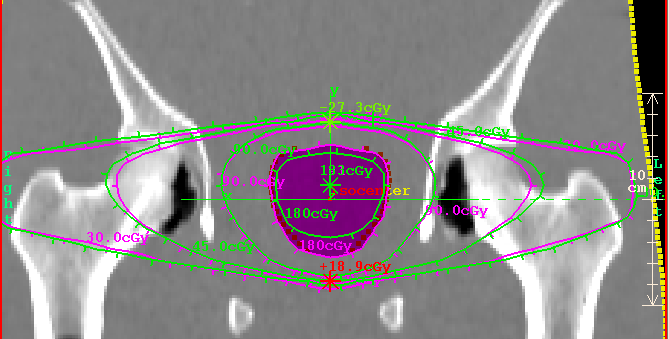
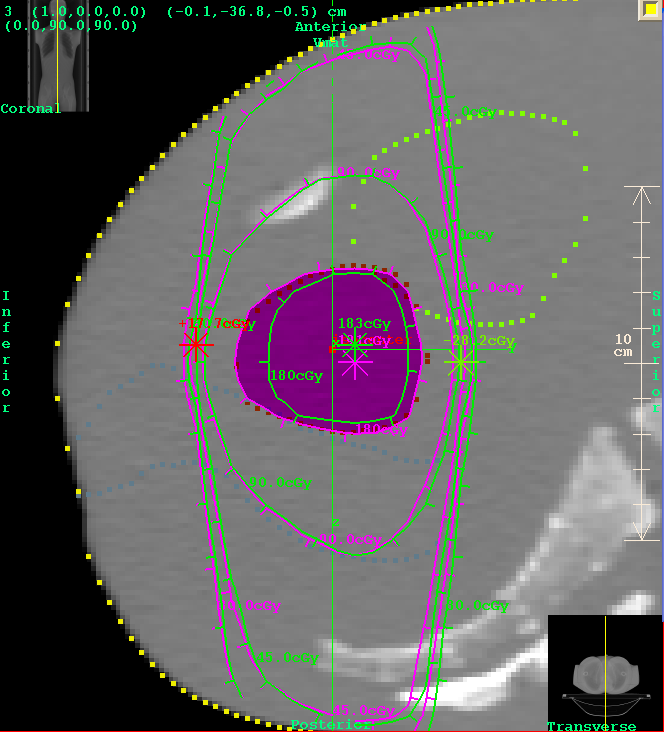
Shown below are DosimetryCheck isodose curves in magenta, compared to
the plan in green. Either the plan dose may be tinted in green,
or the DosimetryCheck dose may be tinted in magenta for a particular isodose
value, for ease of comparison.
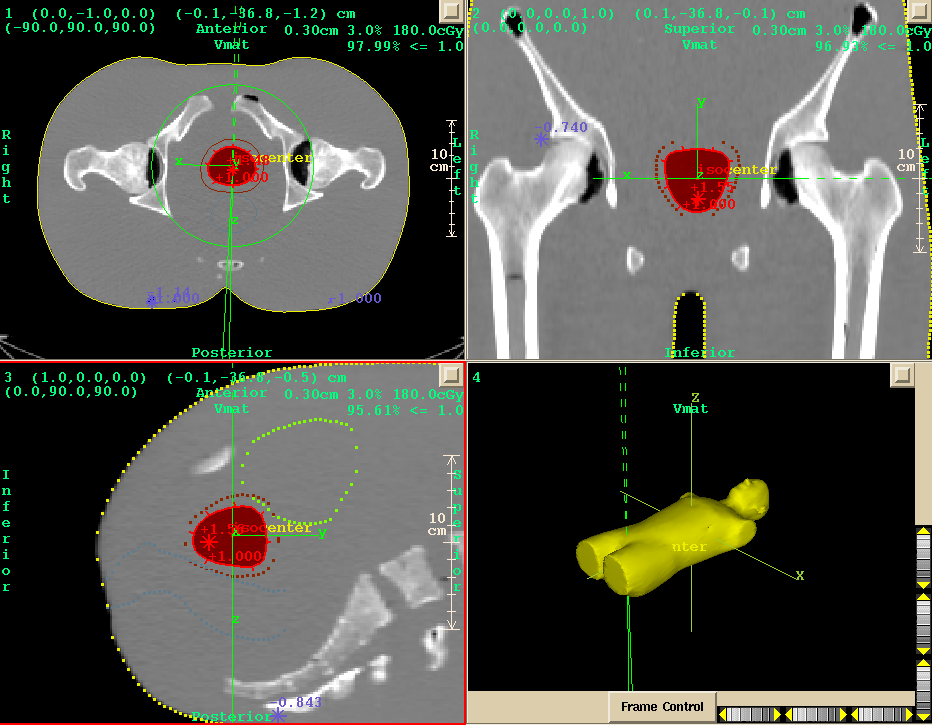
Shown below is the transverse plane through isocenter for doses of 180,
90, 45, and 30 cGy.
![]()
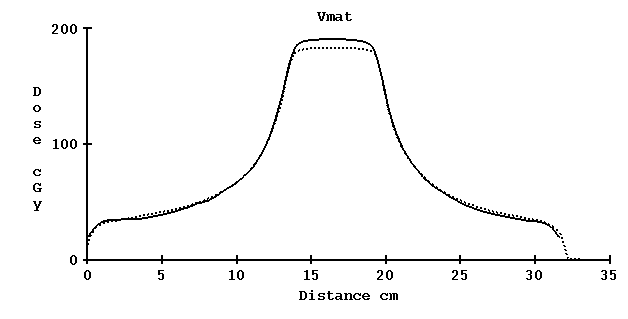
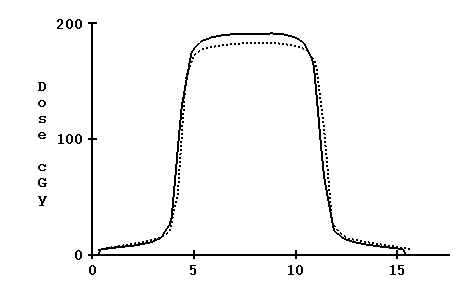
We can also compare the profile along a line. Below is the profile
along the X axis, patient right to left, through isocenter.
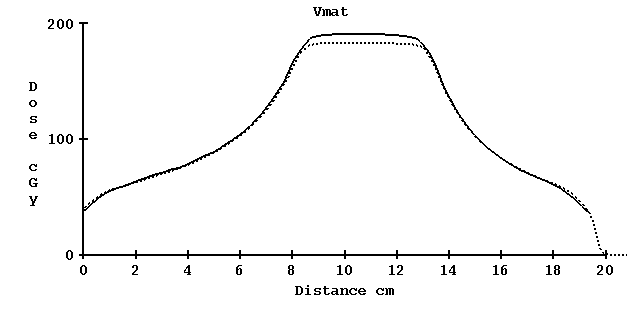
Solid line is the reconstructed dose, dotted is the planning system dose.
We see that the dose agrees nicely until we reach the target area. This
will also be seen in the dose volumn histogram and gamma displays
below.
Next below is the profile along the Z axis, patient posterior to
anterior, through isocenter.
Shown below is the coronal plane throught isocenter dose comparison
for doses of 180, 90, 45, and 30 cGy.
Shown below is the sagittal plane.
Next below is the profile along the Y axis, patient inferior to
superior, through isocenter.
Next we consider gamma analysis. We use a criteria of 3% of 180 cGy or 3 mm. A gamma (absolute) value of 1.0 or less means that the dose at a point either agreed to within 3% or it was less than 3 mm to a point with the same dose (searched in the 3D).
Shown below is the gamma value of 1.0 isocurves in the same transverse,
coronal, and sagittal planes. The areas we noted above have a gamma
value > 1.0 in this case. Areas tinted red had a dose greater than
the planned dose, blue is less than the planned dose. Notice also
that in the planes, 96 to 98% of the plane has a gamma value <= 1.0.
Gamma hot spots are identified with the * with the gamma value for
dose > plan red, dose < plan blue.
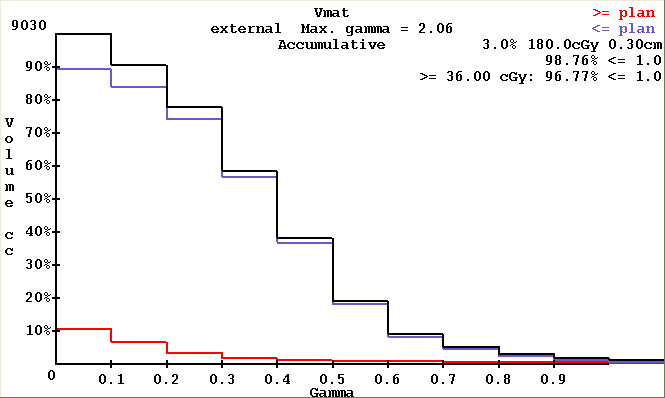
Next we may consider a gamma volume histogram. Shown is that for the
whole body where we see that 98.8 percent of the points in the body
have a gamma value less than 1.0, and
96.8% of the points with a dose greater than
36 cGy (20% of the prescription) has a gamma value less than 1.0.
This plan delivery clearly passes.
Experience is needed to establish passing criteria. The gamma
volume hisogram can be generated for any region of interest (ROI)
volume.
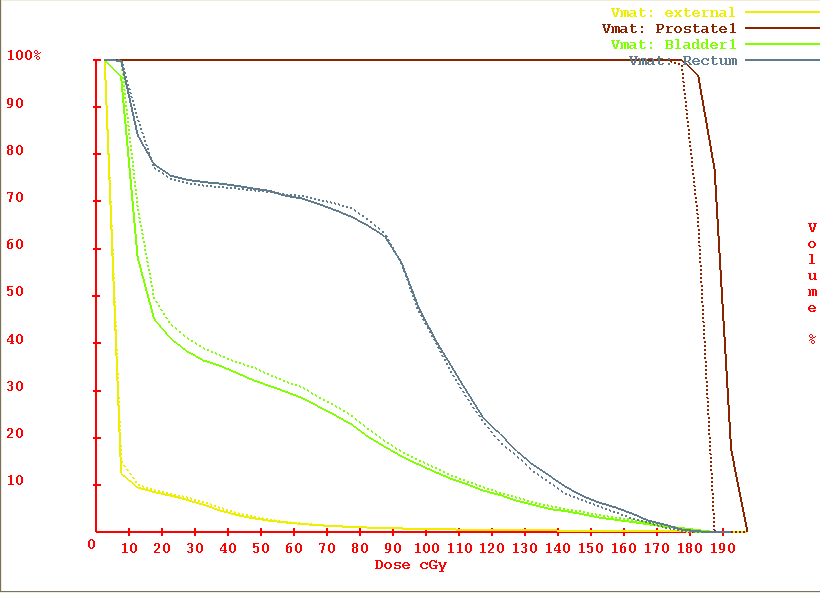
Lastly we can compare dose volume histograms between the plan and
the dose reconstructed here. Dotted is the histogram computed from
the 3D dose matrix from the planning system. Solid is from the
dose distribution reconstucted here by DosimetryCheck for some
selected ROI volumes.
We hope you enjoyed this example case of verification of treatment delivery with the Elekta IviewGT EPID and DosimetryCheck. This particular case exhibited good agreement.
The time and effort required is a dry run without the patient to integrate the fields and then generation of a report. You will have documented verification that the plan is being delivered. The assumptions are that (1) the beams are on the patient where they should be and (2) that the accelerator is calibrated correctly since we calibrate here in terms of monitor units and (3) that the correct energy was used during treatment.
Return to DosimetryCheck page.