
|
www.MathResolutions.com
Software Products for the Radiological Sciences
| Search |
|
www.MathResolutions.comSoftware Products for the Radiological Sciences |
|
| Home Page | Product Review | Program Manuals | Download Programs | Purchase | Site Map |
| Dosimetry Check | MarkRT (VGRT) | RtDosePlan | System 2100 | MillComp | C++ Library |
The treatment plan may be downloaded in RTOG or Dicom RT format. Several tools are provided for comparing the dose.
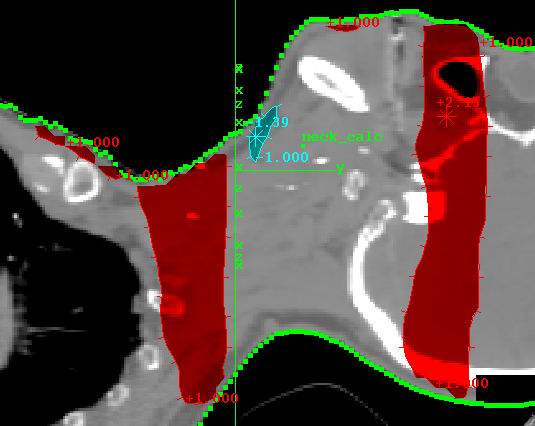
The gamma method may be used with the distribution of the gamma value shown on 2D and 3D images. Shown here is an example of the value of 1.0 being shown for a criteria of 3 percent and 3 mm. Dose areas with a gamma value of 1.0 or more, hence the dose disagrees by either more than 3% or 3 mm, are tinted red in this example if dose > plan, cyan if dose < plan.
See the reference
in Medical Physics by Daniel Low, et. al., Vol 25(5) May 1998, pp. 656-661,
"A technique for the quantitative evaluation of dose distributions."
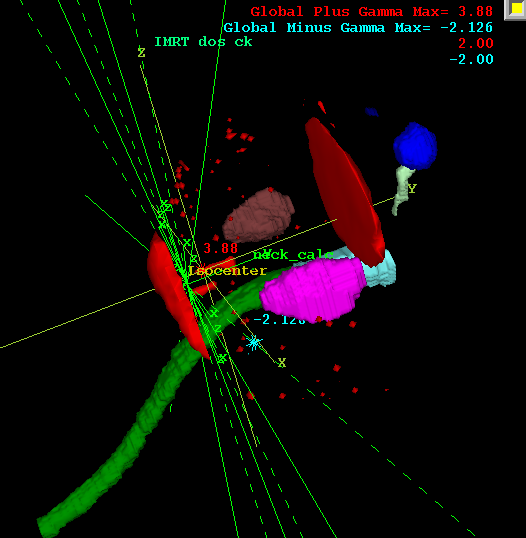
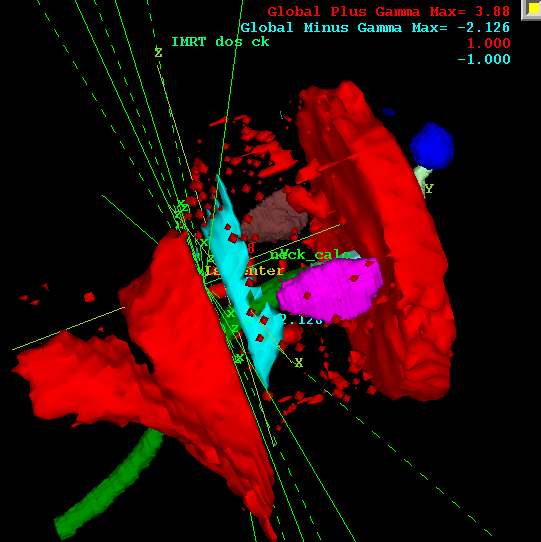 The same distribution may also be shown in three dimensions. Here
the 3D distribution of gamma value of one is also shown (red
where dose > plan, cyan where dose < plan).
The same distribution may also be shown in three dimensions. Here
the 3D distribution of gamma value of one is also shown (red
where dose > plan, cyan where dose < plan).
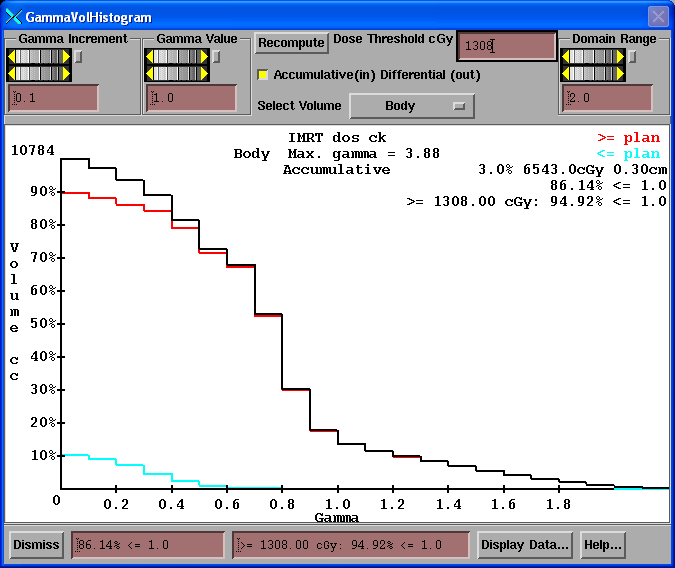
Dosimetry Check can recompute the dose volume histogram for
a region of interest and
the dose volume histogram (dotted) from the 3D dose matrix downloaded
from the planning sytem. In the case shown here, there were differences
due possibly to tongue and groove effect for an IMRT case.
 The case was done twice with Dosimetry Check, once with Kodak V film
(solid) and once with Kodak EDR2 film dashed. The target volume was
very small, 7.4 cc, and represented a difficult IMRT case, with the CTV
up next against the left eye. A small difference in the beam fluence
film and that predicted could be seen. Here we show the effect of
the small change in the delivery. This could not be appreciated without
Dosimetry Check.
The case was done twice with Dosimetry Check, once with Kodak V film
(solid) and once with Kodak EDR2 film dashed. The target volume was
very small, 7.4 cc, and represented a difficult IMRT case, with the CTV
up next against the left eye. A small difference in the beam fluence
film and that predicted could be seen. Here we show the effect of
the small change in the delivery. This could not be appreciated without
Dosimetry Check.
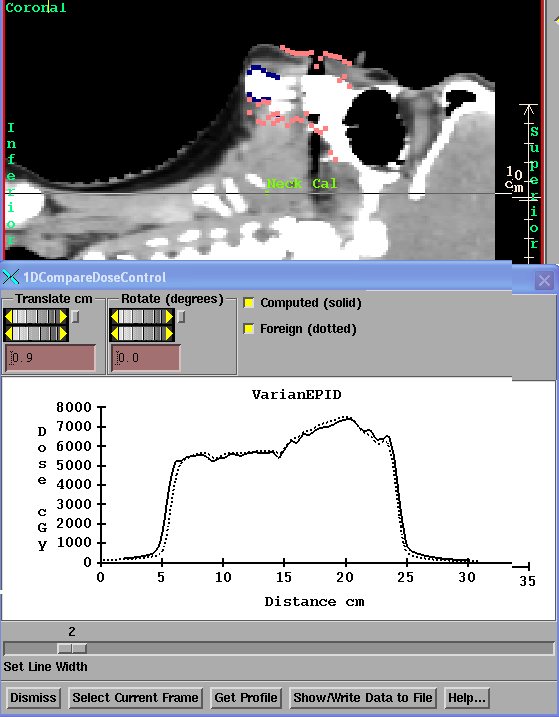
The downloaded treatment plan profile may be shown, dotted, along with the dose computed here, solid. Shown below is the dose from a head and neck case. The translate and rotate controls are used to position the line on the display of any reformatted image that defines where the profile is taken from.
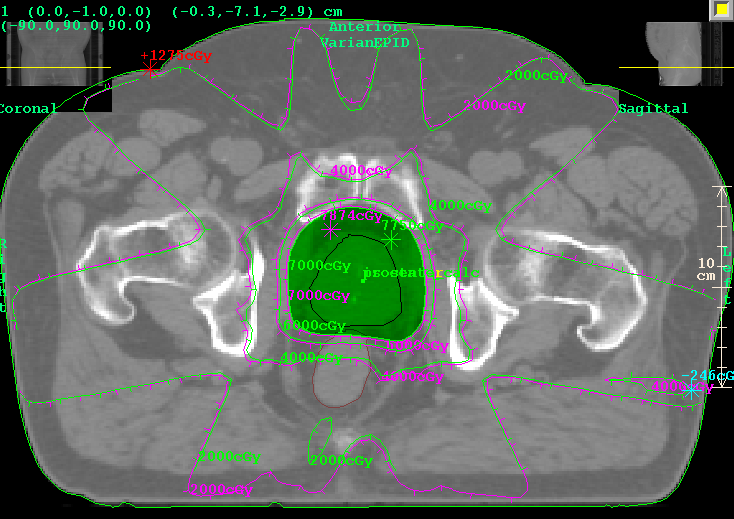
The downloaded treatment plan may be shown (green) along with the dose computed here (magenta). Shown below is the dose from a seven field prostate case.
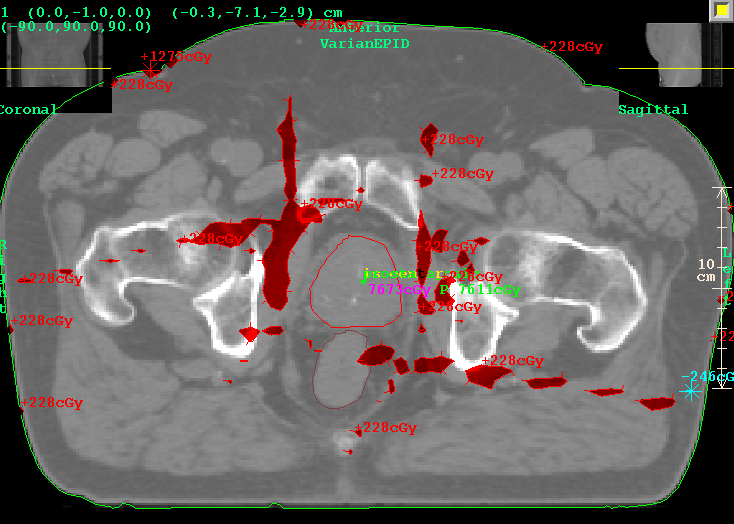
Next below we show a 2D display of the dose difference for a six field prostate case. Difference isodose lines can be plotted or tinted. Shown is 228 cGy, 3.0% in this case. Note hot spot difference of 1276 cGy plus (17%) and 246 cGy minus (3.2%), both in the build up region.
 Here we have purposely
created a case with some difference, seven fields with blocks compared
to the blocks not being there and field sizes different,
for a prostate case. Show below is the
dose comparison in a 3D display. The red is where a larger dose was
computed, the cyan where a smaller dose was computed. The bladder is
colored brown and shown above, the rectum below, and the femur's to
either side.
Here we have purposely
created a case with some difference, seven fields with blocks compared
to the blocks not being there and field sizes different,
for a prostate case. Show below is the
dose comparison in a 3D display. The red is where a larger dose was
computed, the cyan where a smaller dose was computed. The bladder is
colored brown and shown above, the rectum below, and the femur's to
either side.
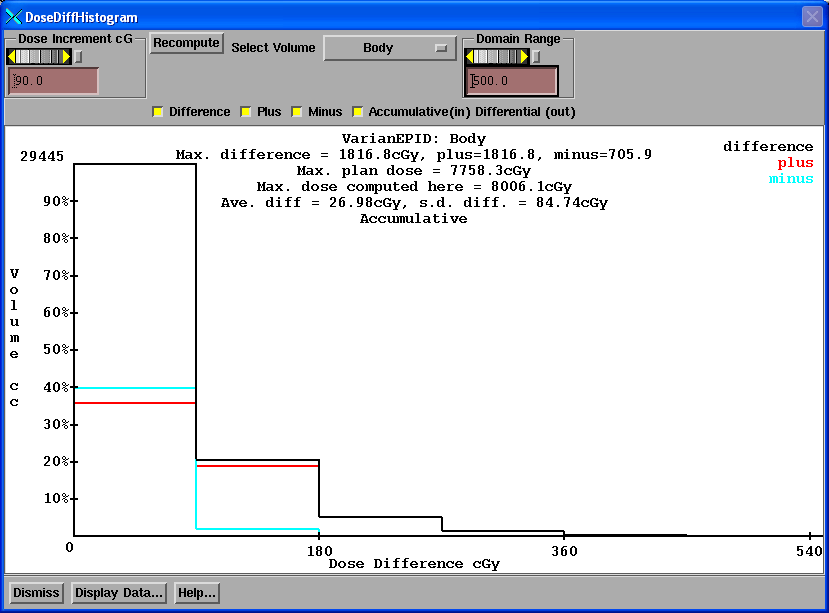
You may compute, display, and print a difference dose volume histogram
for any outlined volume.
Return to Prior Page
Return to homepage
Math Resolutions, LLC