|
www.MathResolutions.com
Software Products for the Radiological Sciences
| Search |
|
www.MathResolutions.comSoftware Products for the Radiological Sciences |
|
| Home Page | Product Review | Program Manuals | Download Programs | Purchase | Site Map |
| Dosimetry Check | MarkRT (VGRT) | RtDosePlan | System 2100 | MillComp | C++ Library |

Download the treatment plan in RTOG or Dicom RT format, or if not available read in the CT scans used for the treatment plan (but then for each beam you will have to locate isocenter and set the gantry, collimator, and couch angles). Assocate the measured picture of the field with each beam. If using film, each film will have to be digitized.
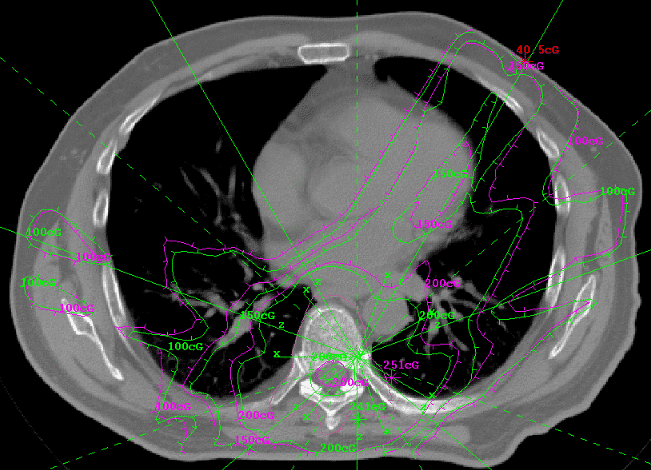
Then calculate the dose distribution. Plot out the same planes and compare to the treatment plan. The dose calculated here depends upon the measured field. Any significant mistake in those fields will show in the dose distribution.
You can compare the plan in the patient, or analyze one beam at a time in the patient or a phantom. The process is the same. Just download what ever plan you want to analyze.
Use the comparison tools to show the dose difference when the dose distribution from the planning system was downloaded (in RTOG or Dicom RT format). You can compute a difference dose volume histogram, and compare the dose on 2d and 3d views.
Your effort here, probably about a half hour. You are done. Return to quality control.
See dose comparison examples and tools:
Dose Comparison Tools.
To include:
dose volume histogram comparison, the gamma method, simultaneous
display of isodose curves, difference displays.
[We also have an option to process the field image files to remove the smoothing of field edges introduced if using solid water to cover the film. See the manual for Deconvolution Routines for more information. However, using 3mm of copper for bolus eliminates that problem so that deconvolution is not necessary.]
Link to Manuals
Return to quality control.
Return to homepage
Math Resolutions, LLC